
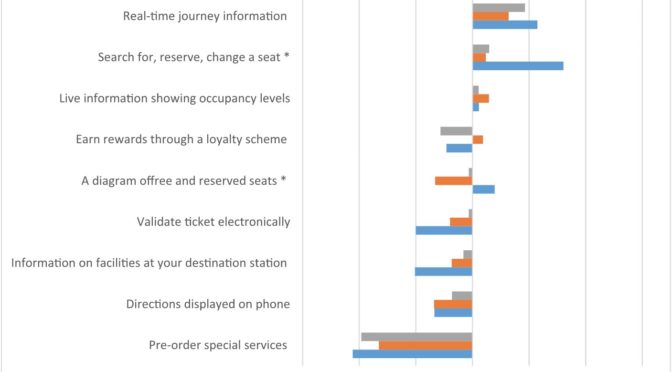
We are seeing the use of alternative approaches to measure user attitudes, specifically, those that offer more robust, useful and actionable attitudinal data. One of these methods is the Best-Worst Scaling (BWS), which has risen in popularity as a choice-based measurement approach. BWS experiments collect both “best” and “worst” information from a set of statements about the product or service offering. These could include attributes, features or product benefits. As such, more information is gathered about the top ranked and … Read more →
All posts by Luis Carlos Rubino de Oliveira

Motivating car drivers to cycle and walk more

The Reflect Project was looking into ways to promote sustainable modes of transport such as walking and cycling instead of driving. … Read more →
Refit Smart Homes

A few years ago I was working for a project evaluating smart home technology, comparing user expectations at the point of installation with experiences 1 year later. … Read more →
How to make excel display sharp time on graph axis
I was trying to make Microsoft Excel display sharp times on graphs, but took me a while to figure out how to. I had this graph of time to complete the task, per group of participants. The X axis displayed the participant group, and the Y axis corresponded to time. But as you can see on the example, instead of showing rounded times like 2, 5 or 10 minutes, Excel was showing fractions like 01:26, 2:53 etc. I would prefer … Read more →