
One of the most used methodologies applied to understand users and their experiences are interviews. Online, phone-based or face-to-face semi-structured interviews are performed to understand user expressions of attitudes, feelings, preferences, needs and behaviours. Using a semi-structured method it’s possible to explore in more depth specific aspects raised by participants, and allow for richer data collection.
Interview prompts
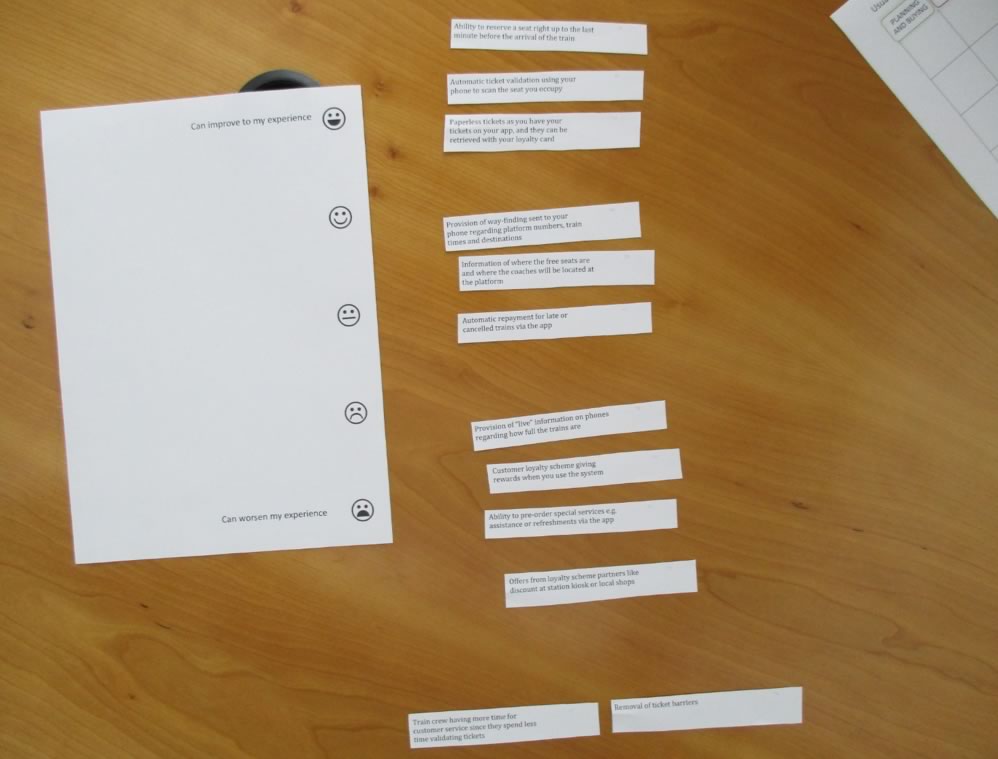
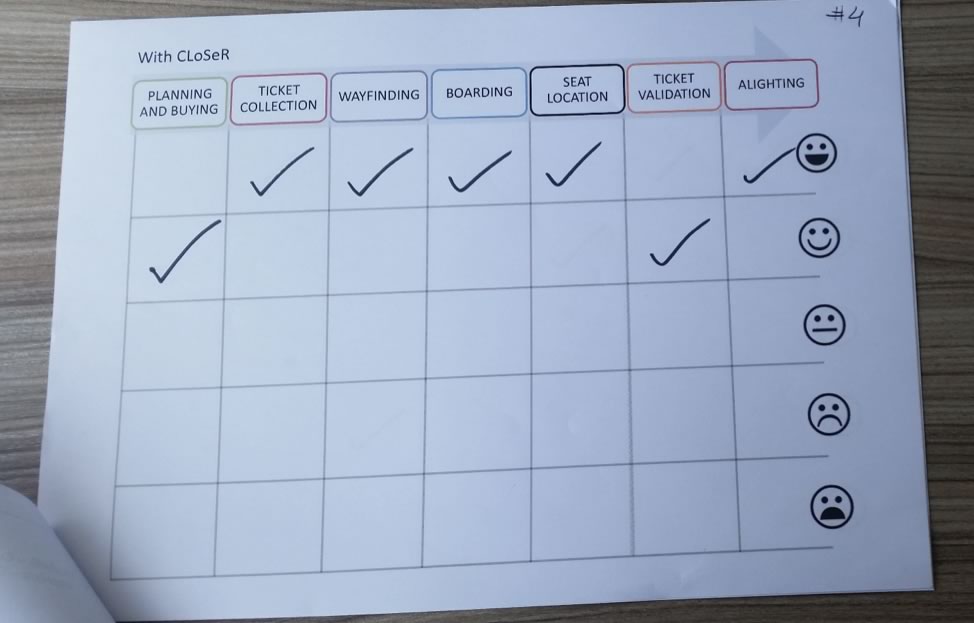
During interviews, it’s possible to use materials to prompt participants to develop their ideas and describe aspects in more details. Examples include low-resolution prototypes, ranking exercises (to place features on a list from best to worst) or smiley scales.
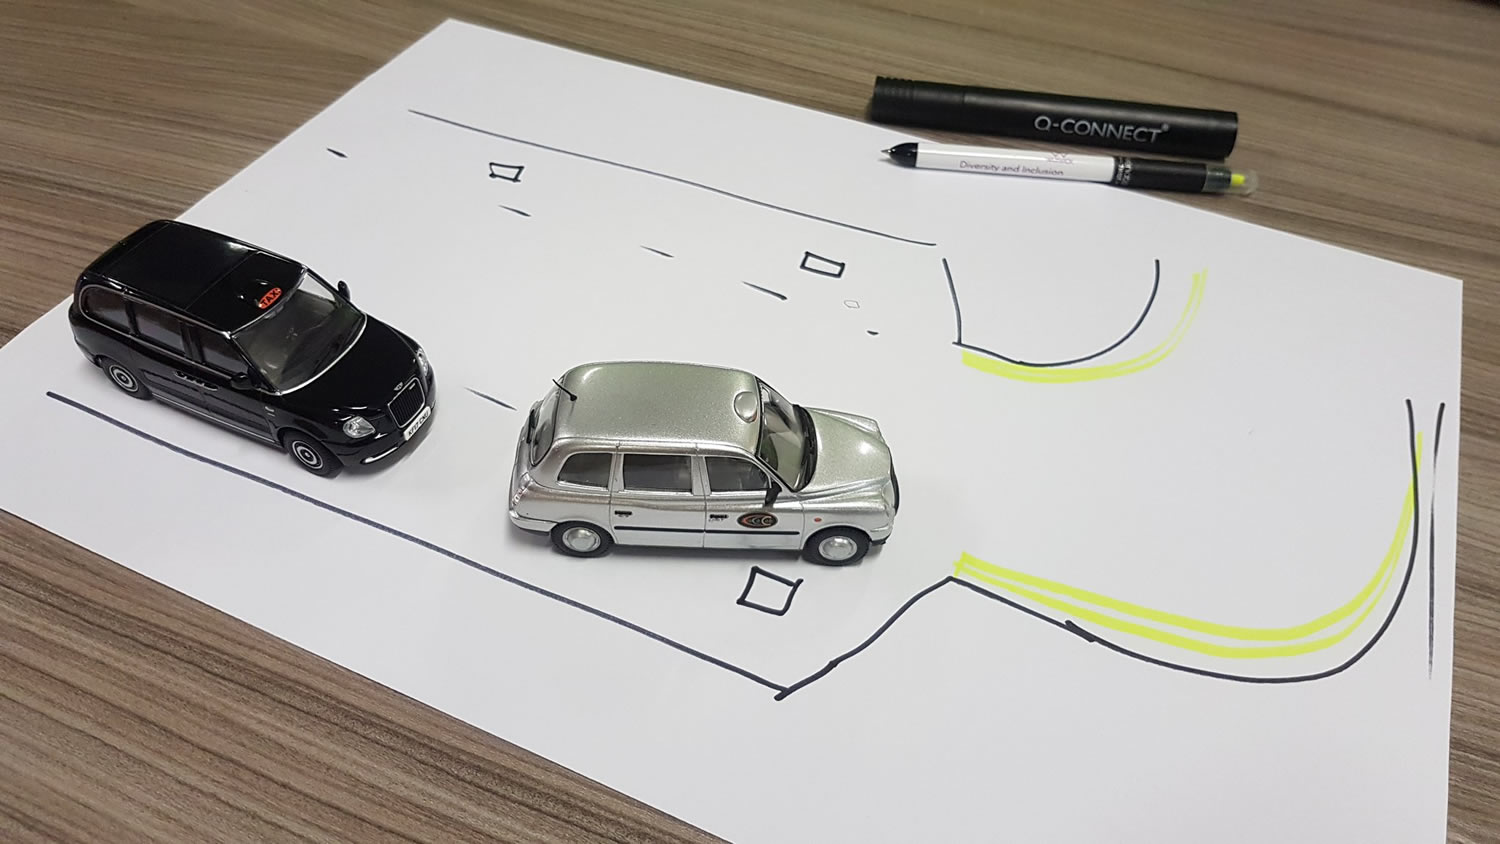
For the work with taxi drivers (both interviews and focus groups) I used miniature of their taxis for them to think about and explain the interactions at taxi ranks. There are ‘gentlemen’ agreements in place, which could be disrupted with the introduction of wireless chargers. Chargers placed on specific taxi bays meant those had to be used primarily by drivers of the new electric vehicles. So my work was to understand these issues and highlight them to the broader consortium team.
An additional strategy is triangulation, targeting the phenomena from two points of view. Through the combination of interviews and other methods such as shadowing or surveys, we can improve the chances of our results being a reasonable representation of the attitudes, needs and behaviours of the sample.
Analysis
Interviews generally produce several hours of recordings, which will have to be analysed in detail. Usually interviews are all transcribed to allow a thematic analysis, which is performed with the help of computational qualitative data analysis software, such as QSR International NVivo. All relevant user statements are coded into nodes or units of information. Themes are then highlighted based on an iterative process of classifying these nodes in hierarchies, ranking them in order of importance and frequency.
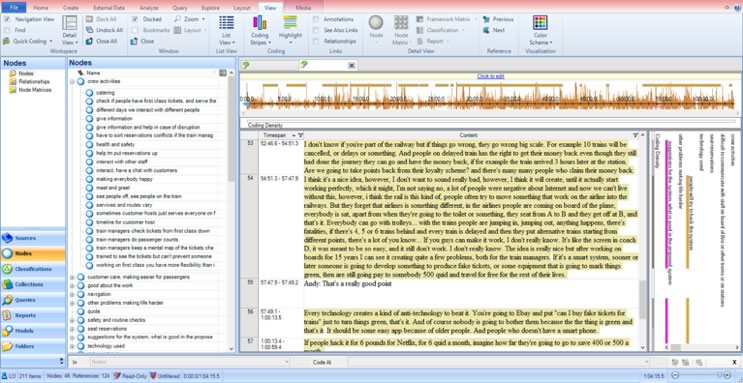
Modern tools like Dovetail (that I describe here) and Copilot AI Research allow us to perform the analysis much faster with automated transcription, tagging content based on pre-defined concepts and doing some initial thematic analysis. These tools are reaching impressive quality levels, although we still need to double-check outputs to guarantee the rigour and trust levels required.