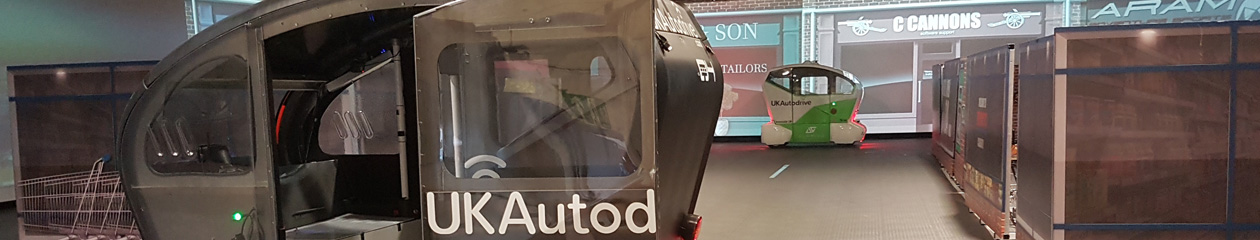
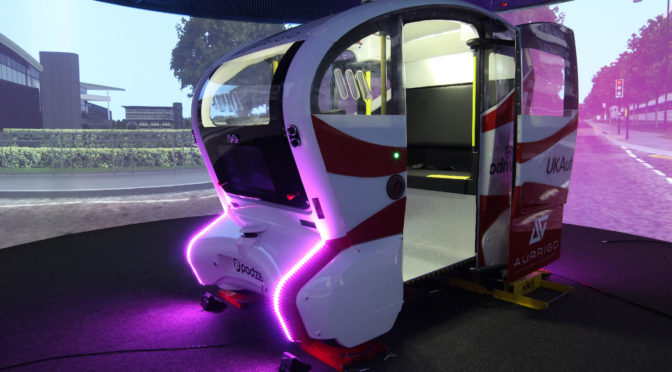
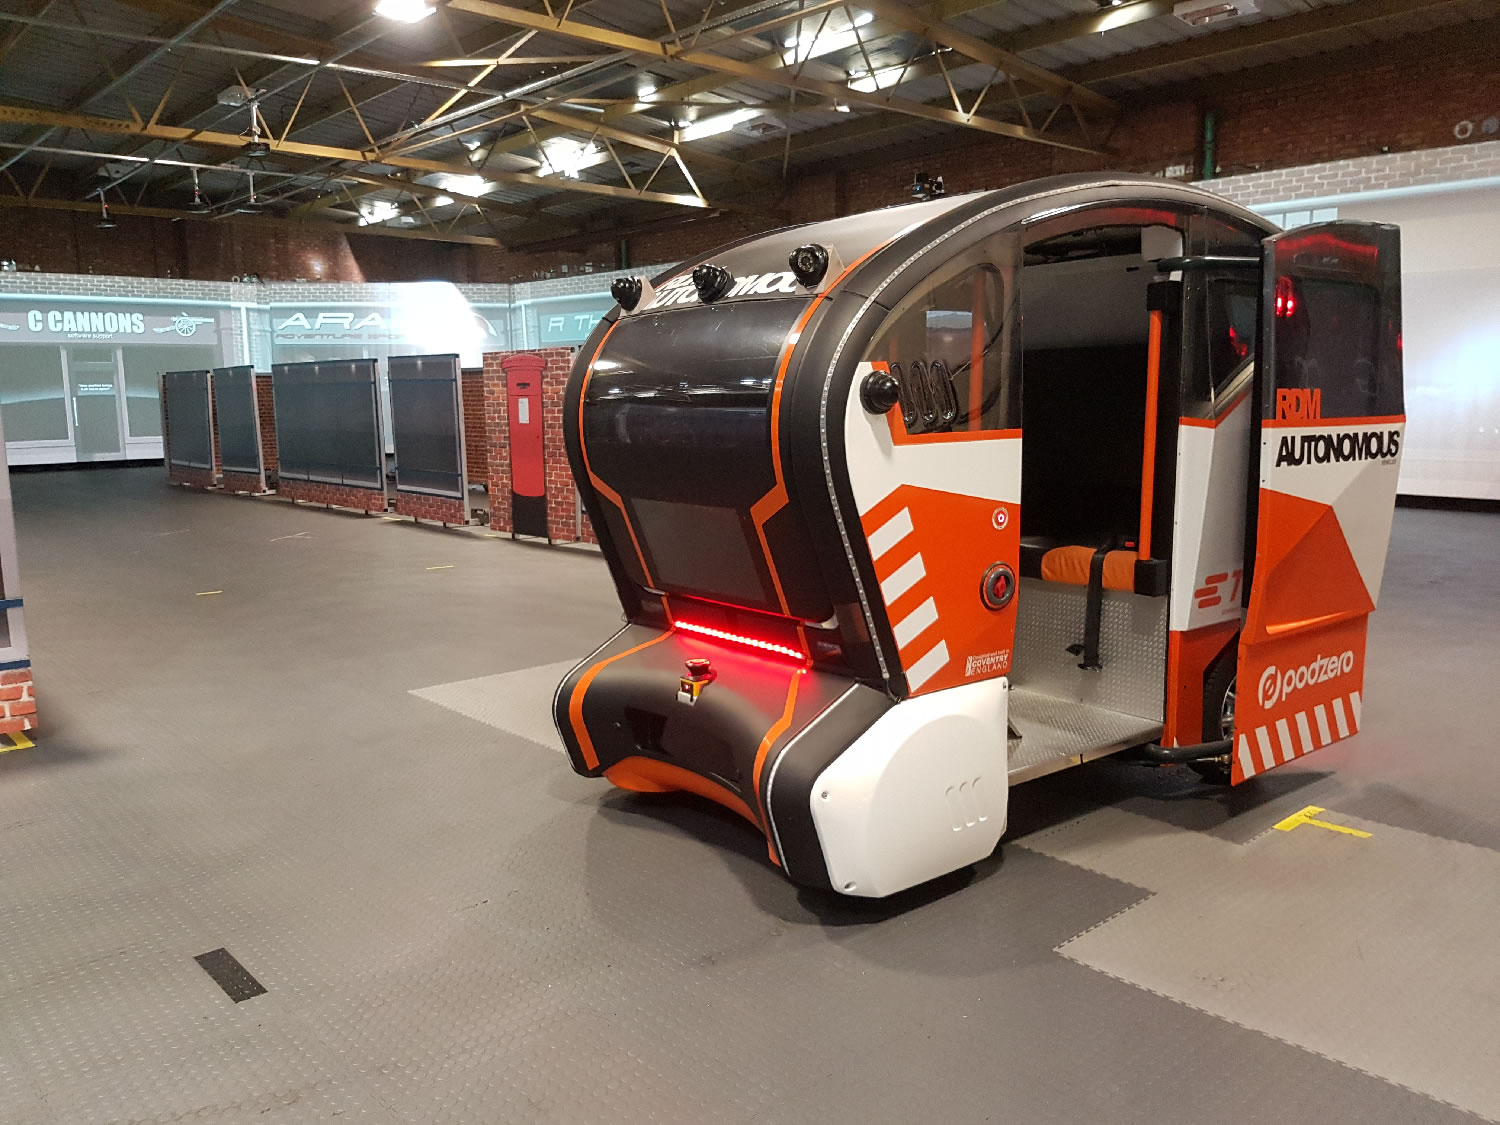
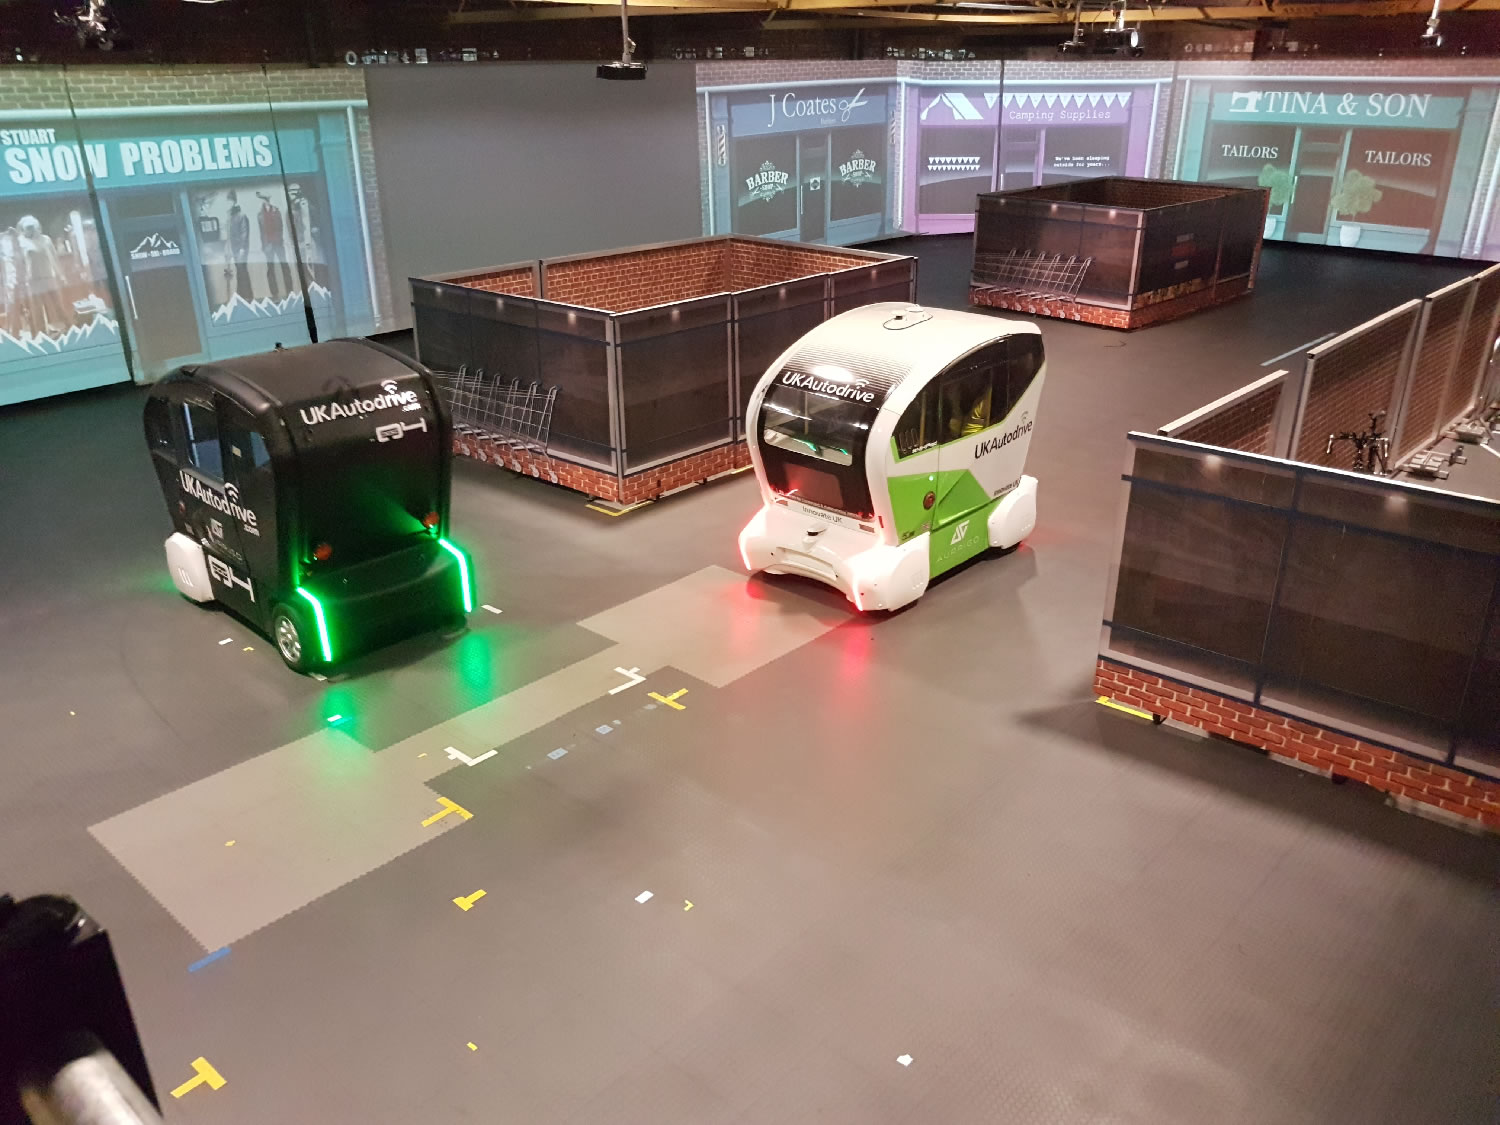
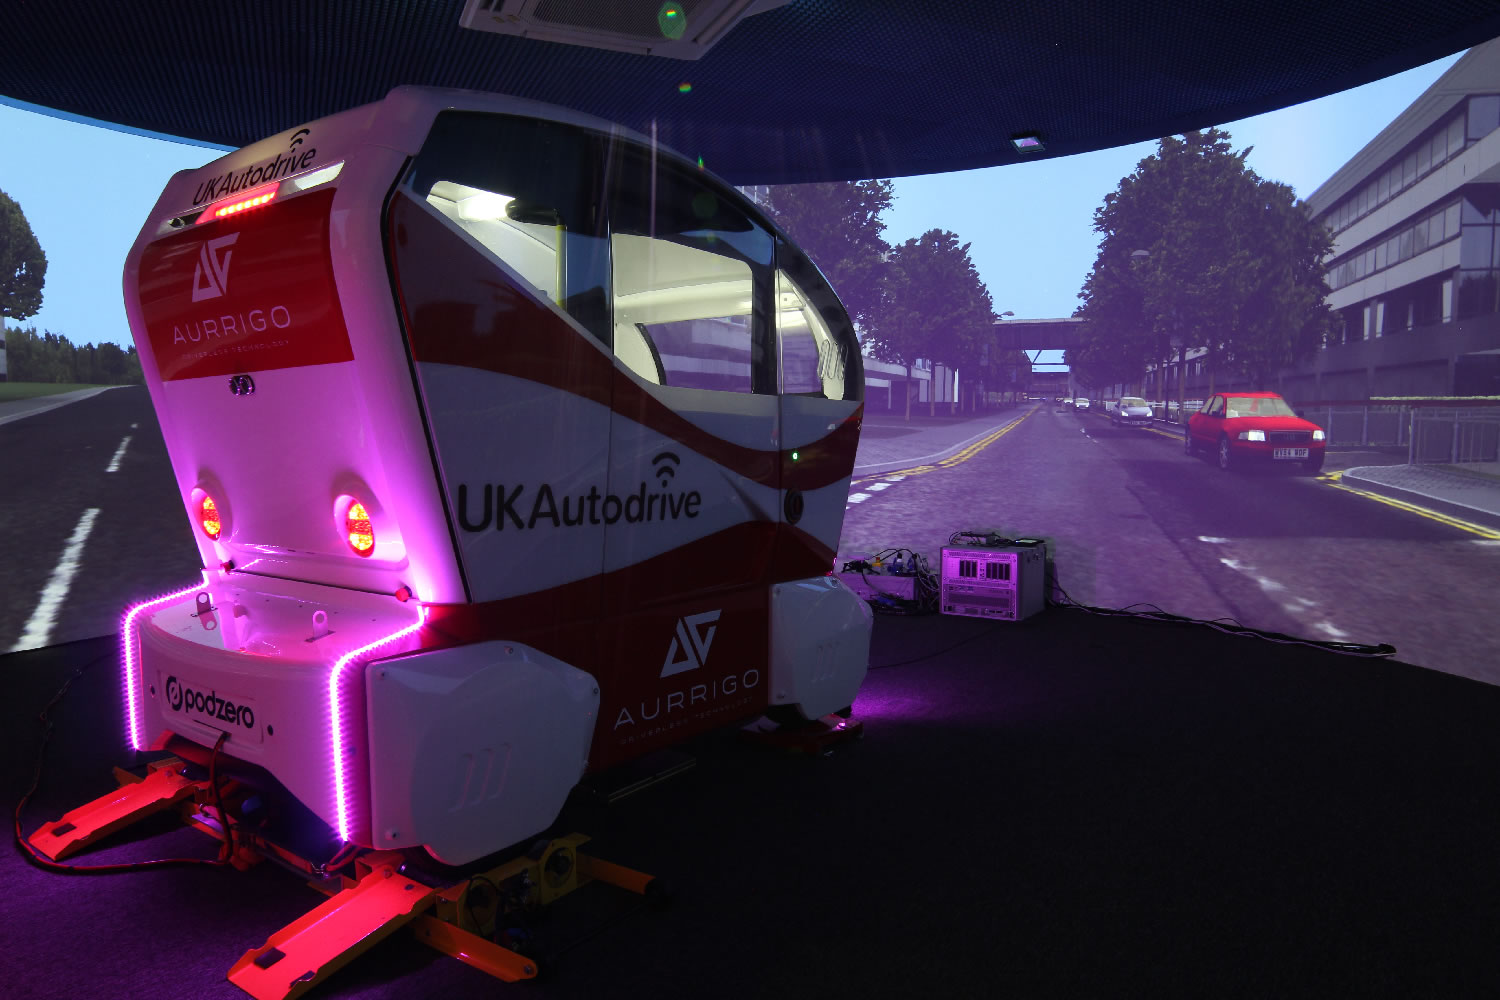
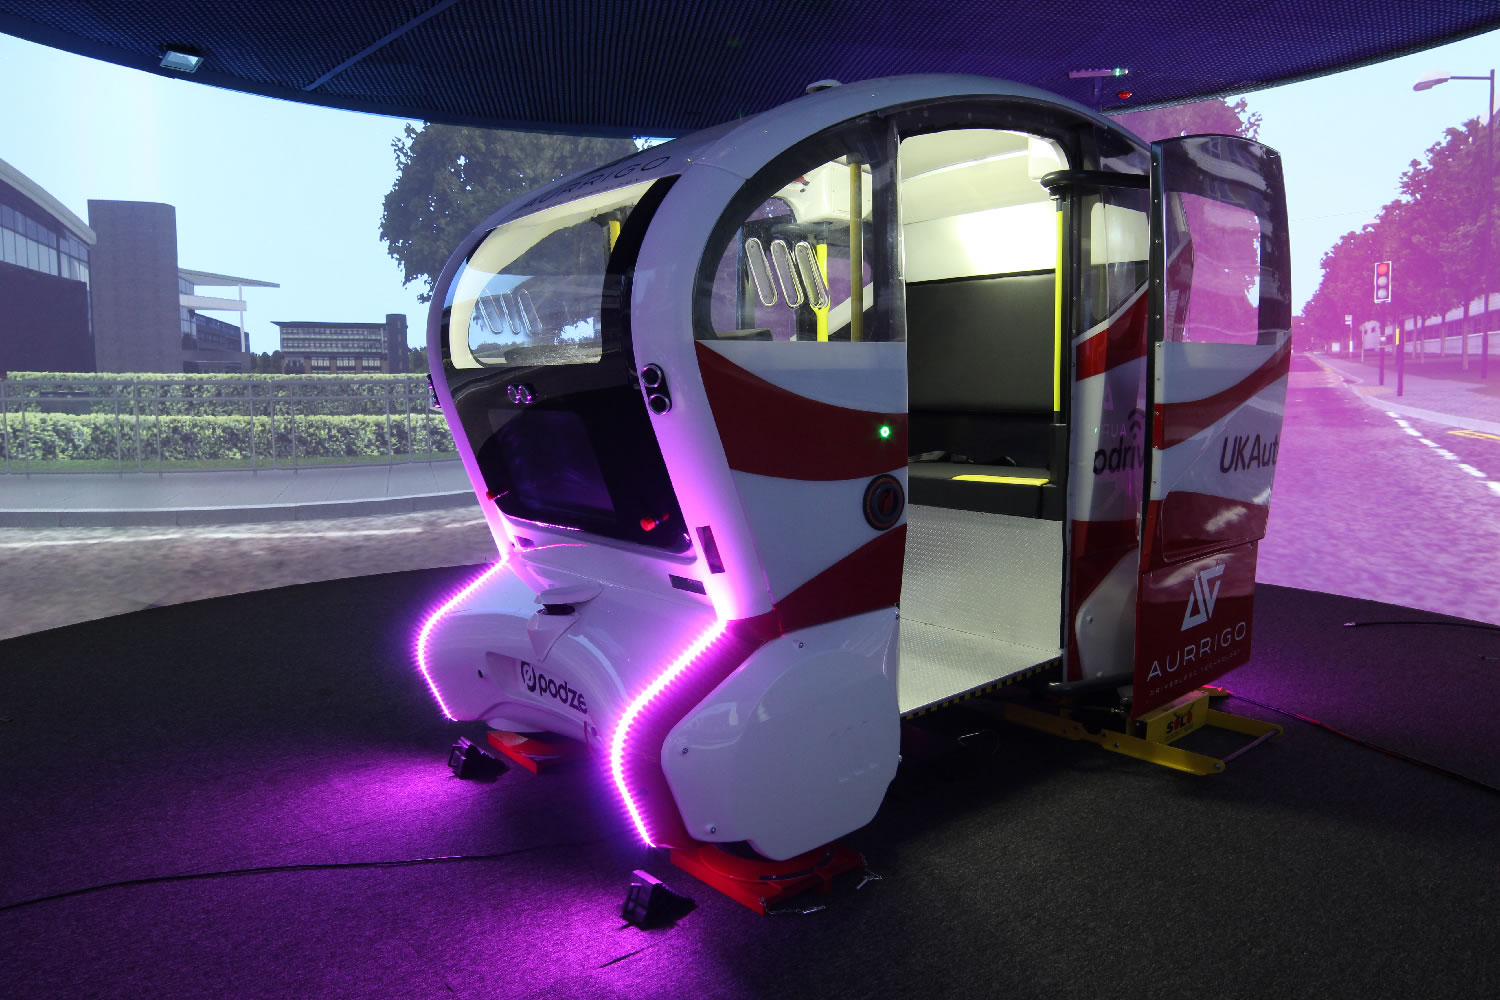
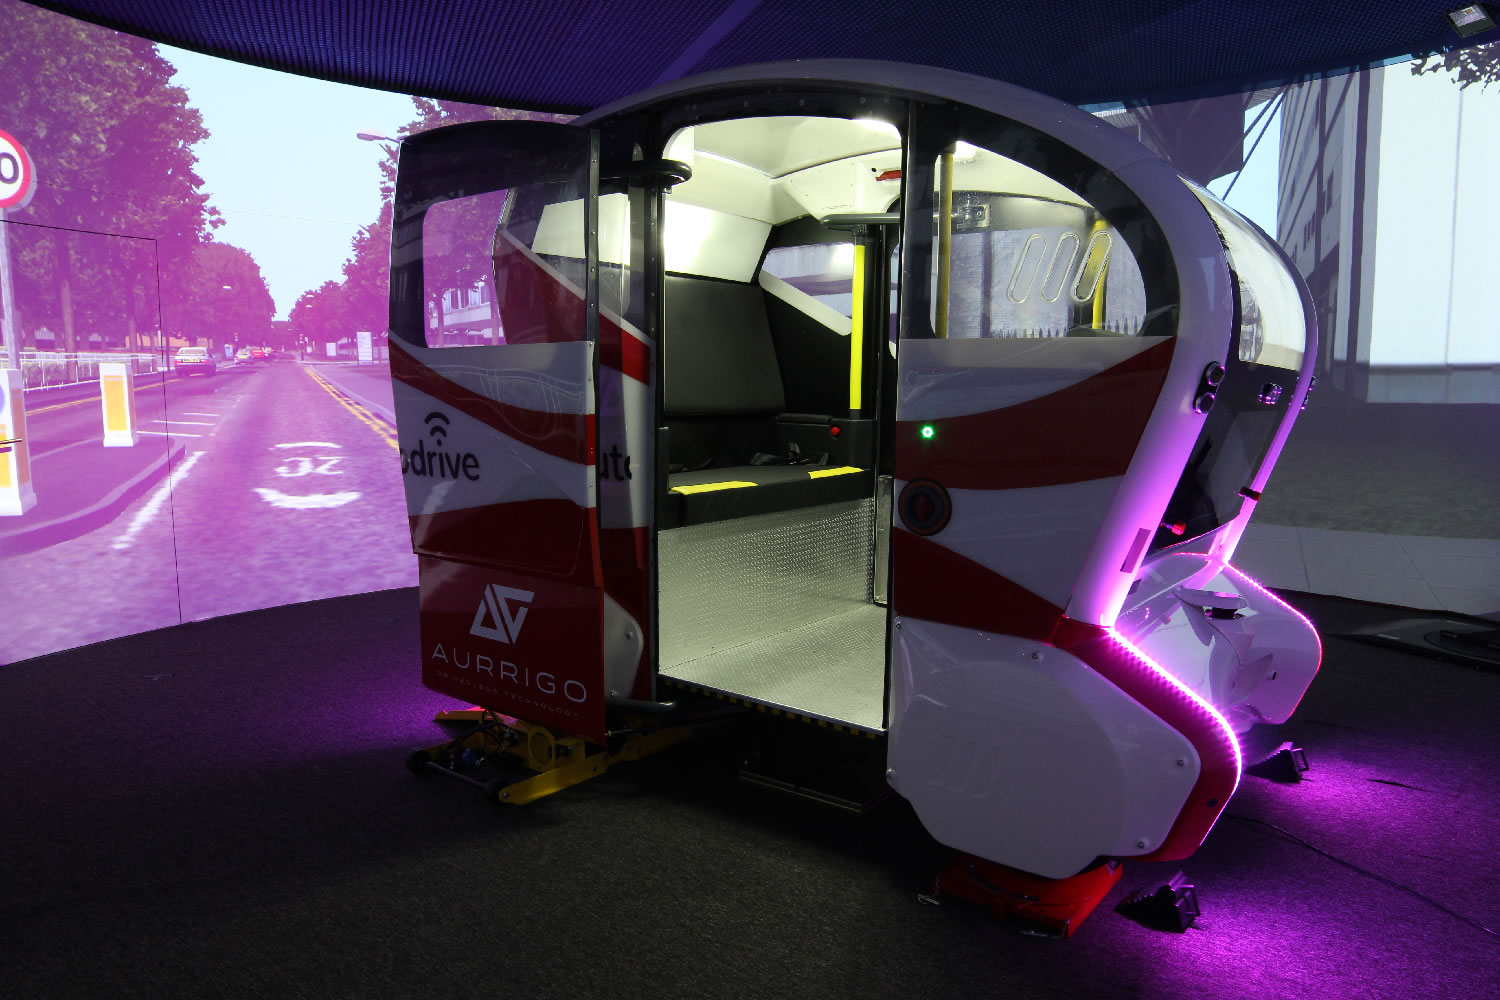
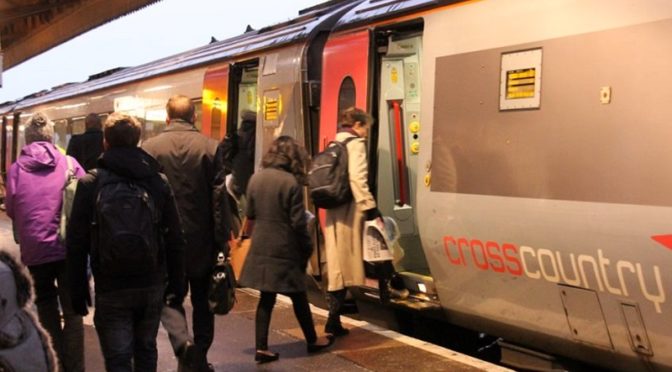
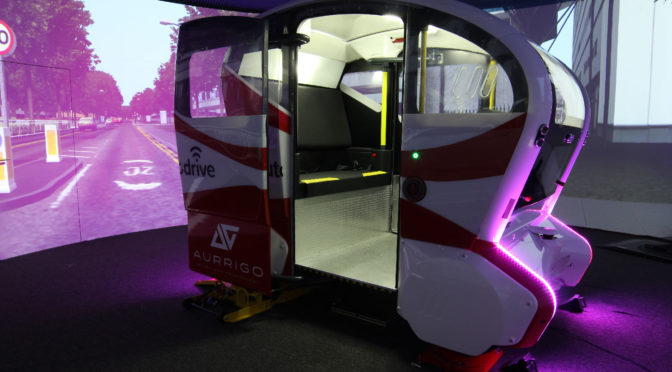
When I was working for the UK Autodrive project I was invited to take pictures of the automated vehicles using during this research. Examples above show my pictures of the vehicles inside the simulator and also within real-world test settings.
These vehicles are short range, low speed highly automated ‘pods’, manufactured by Aurrigo / RDM. They are designed to provide transportation on the first and last miles of journeys, e.g. from a train station to a town centre, or from … Read more →
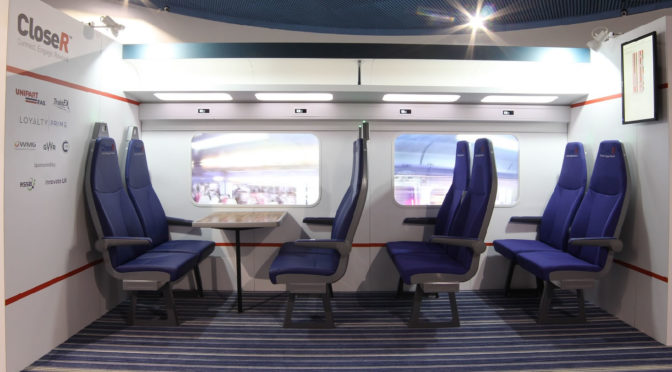
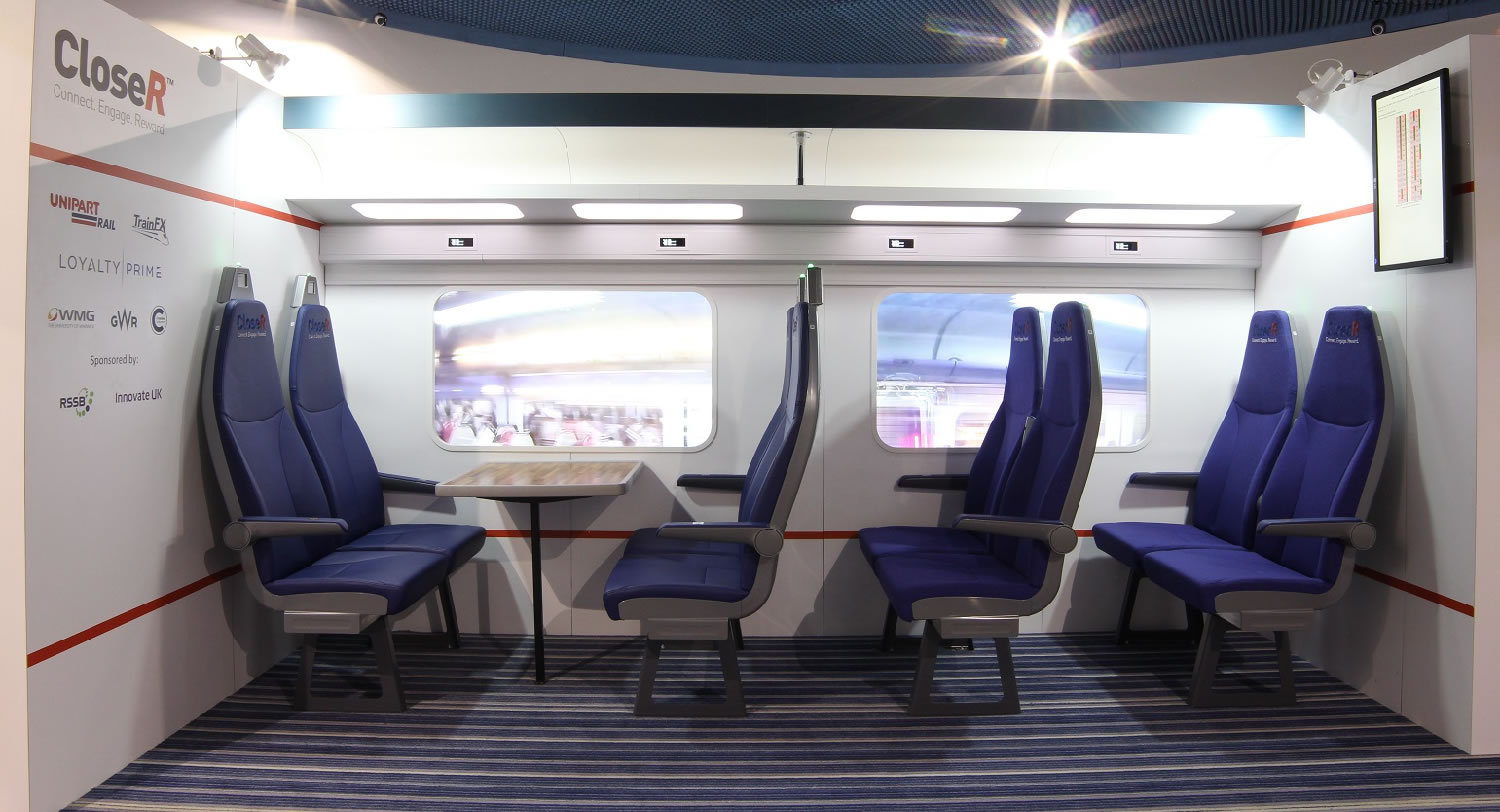
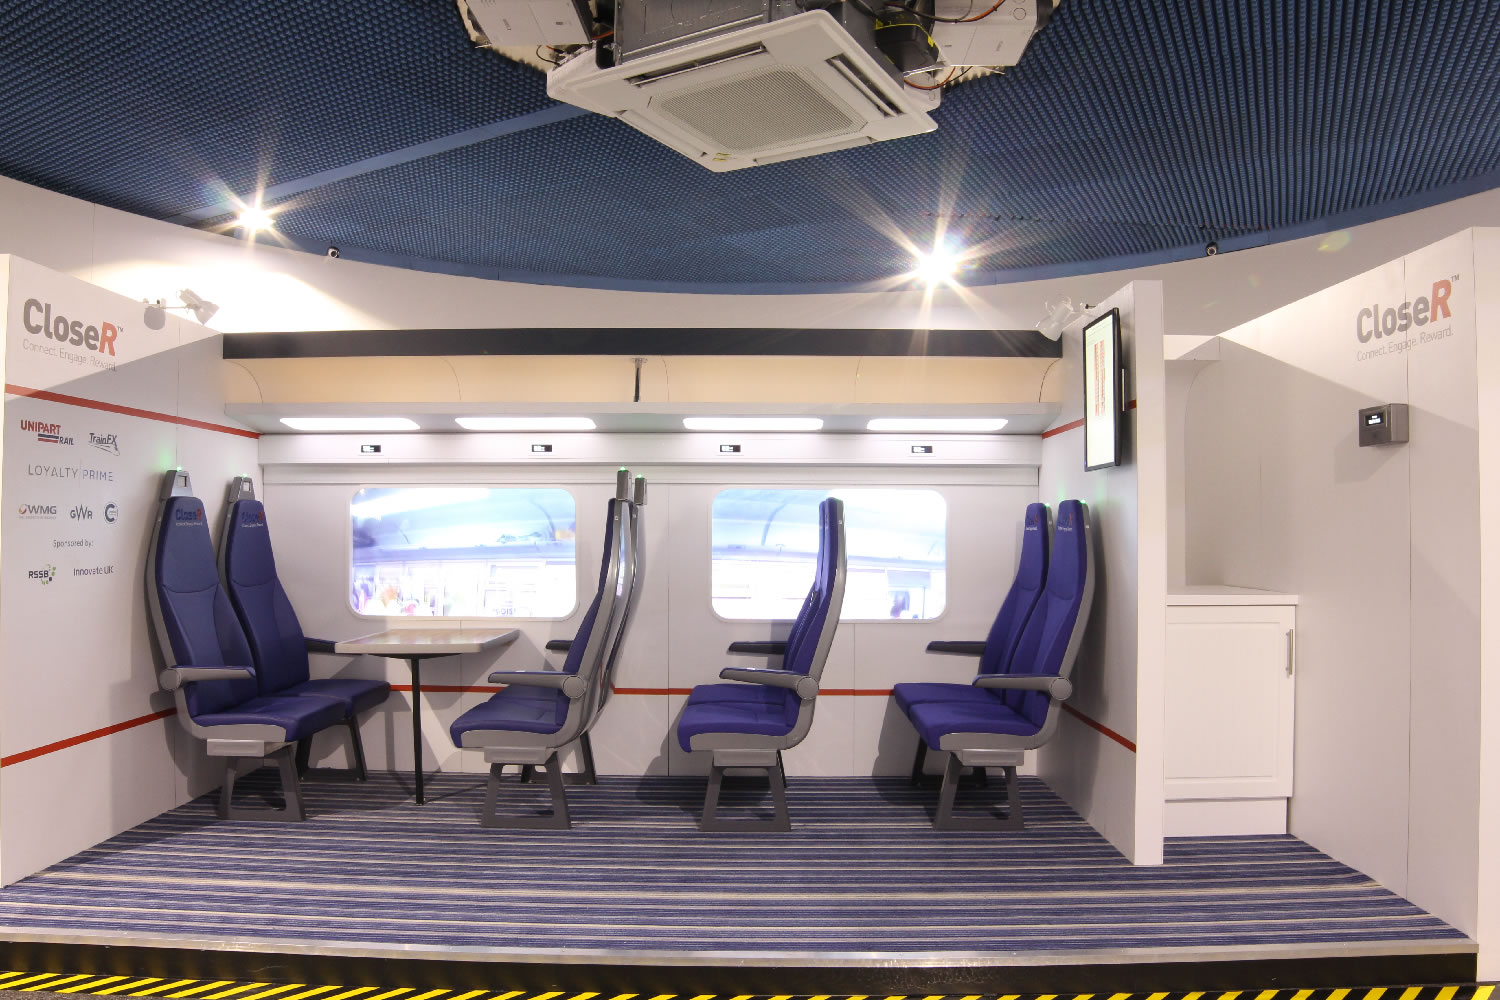
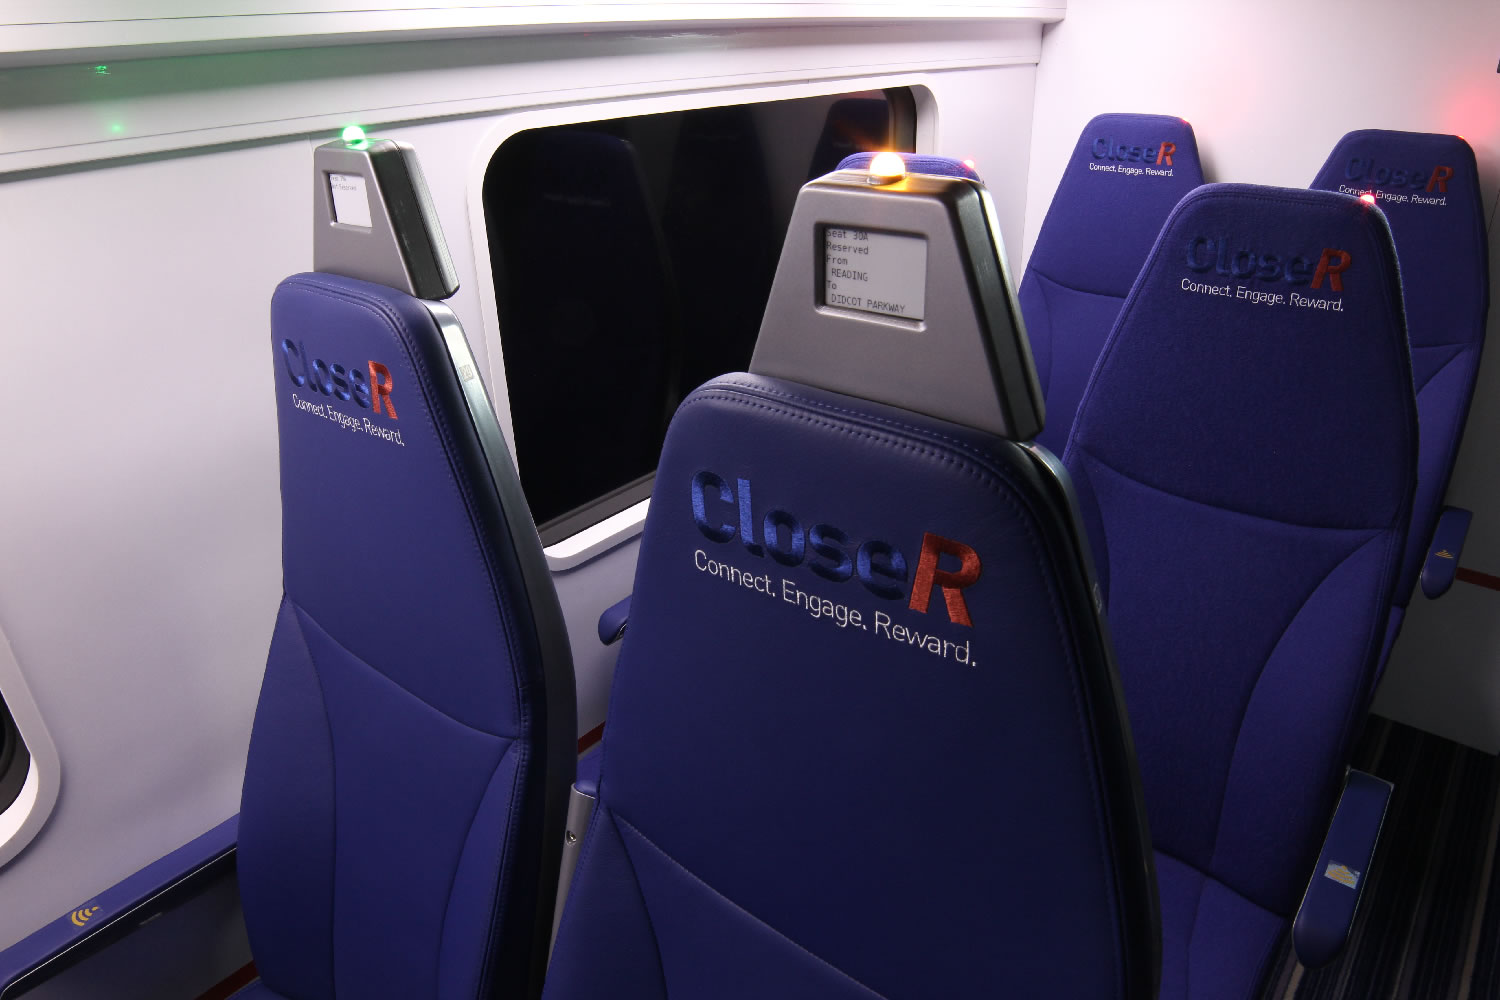
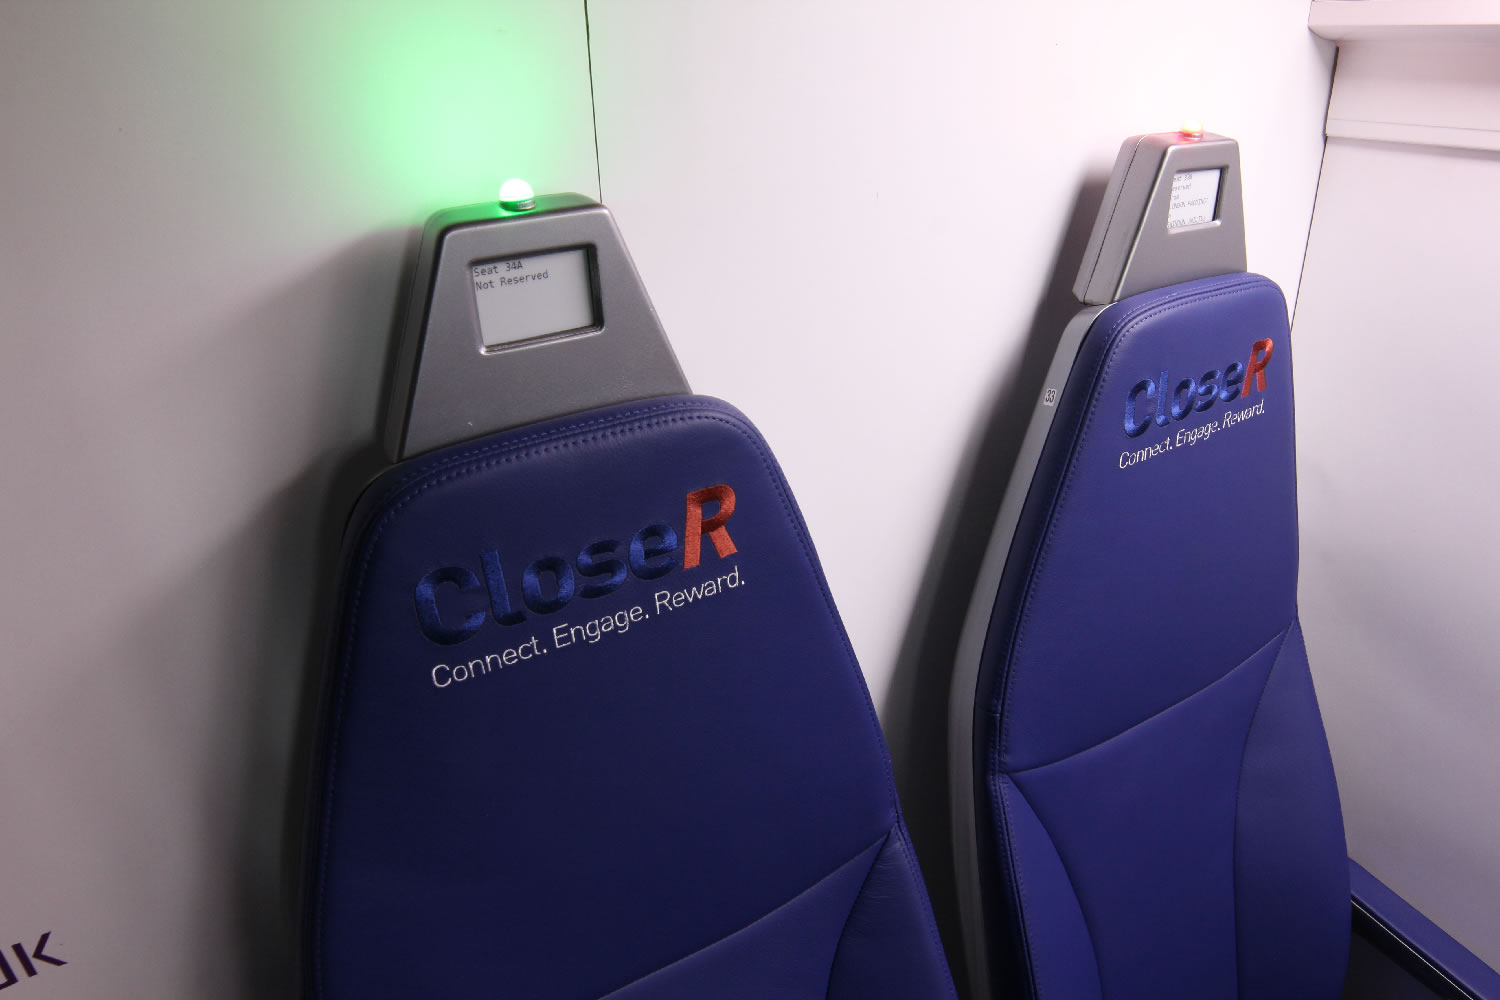
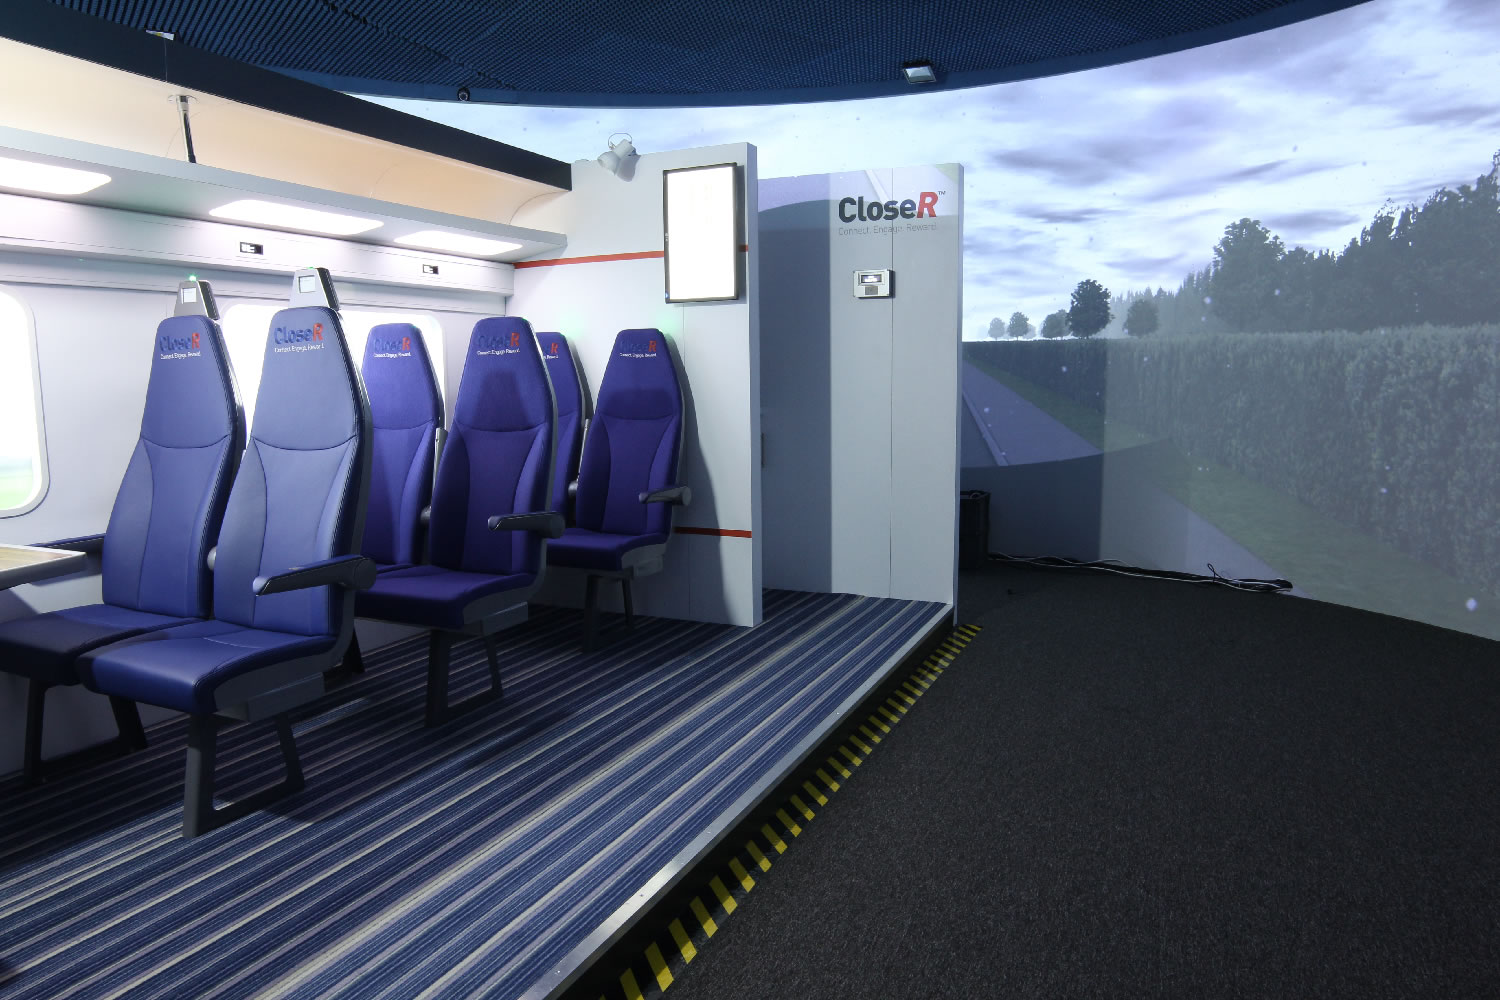
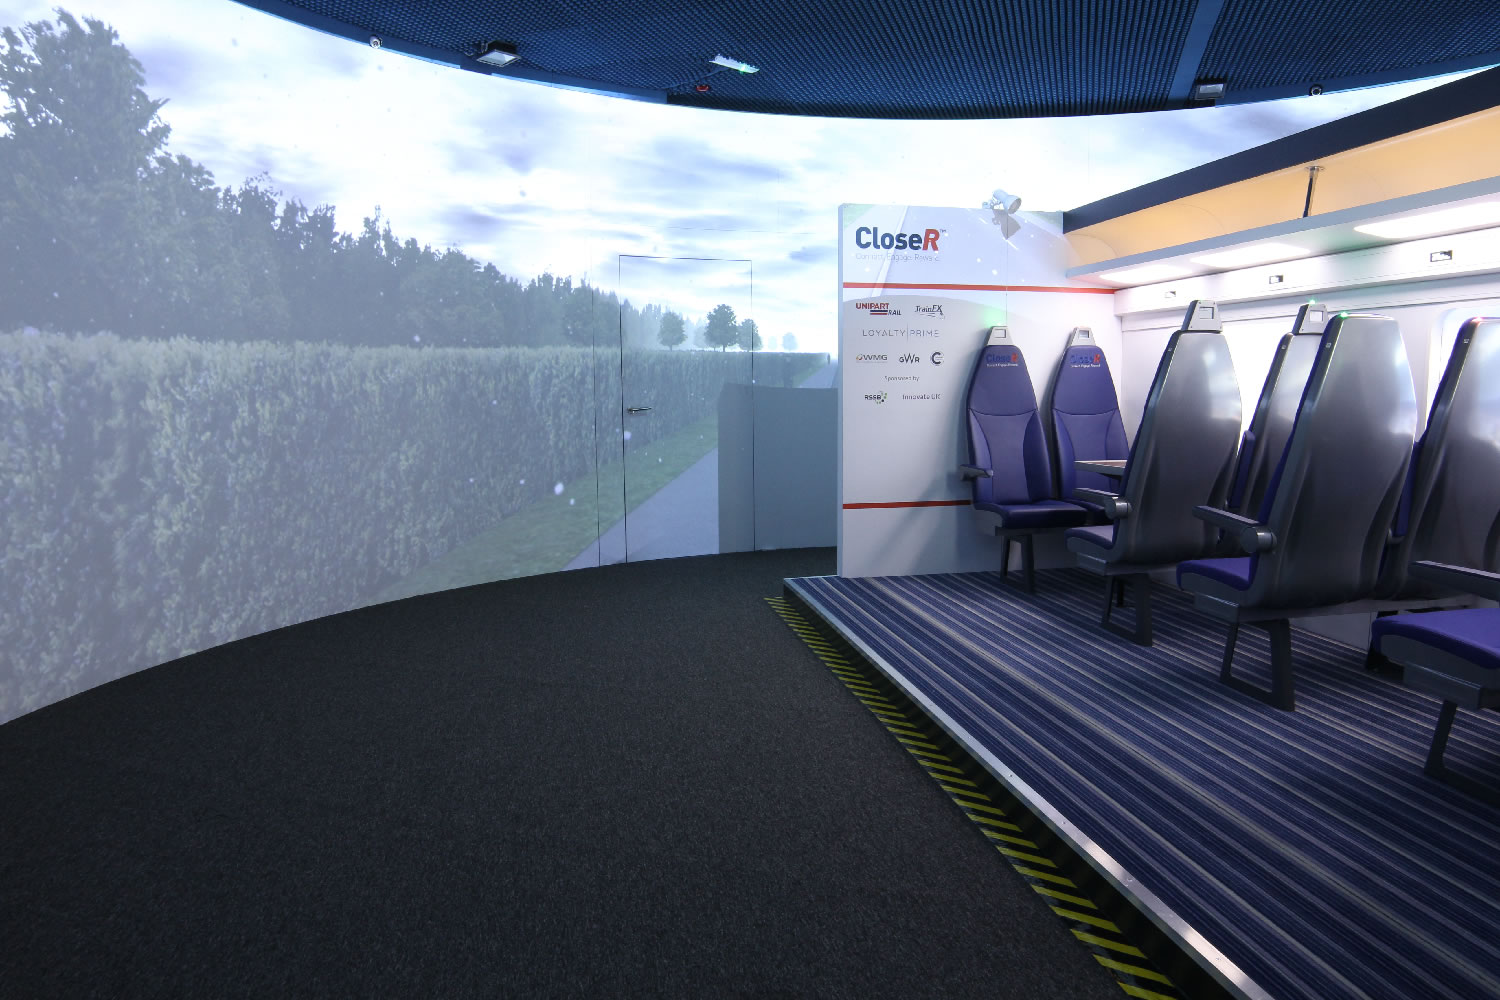
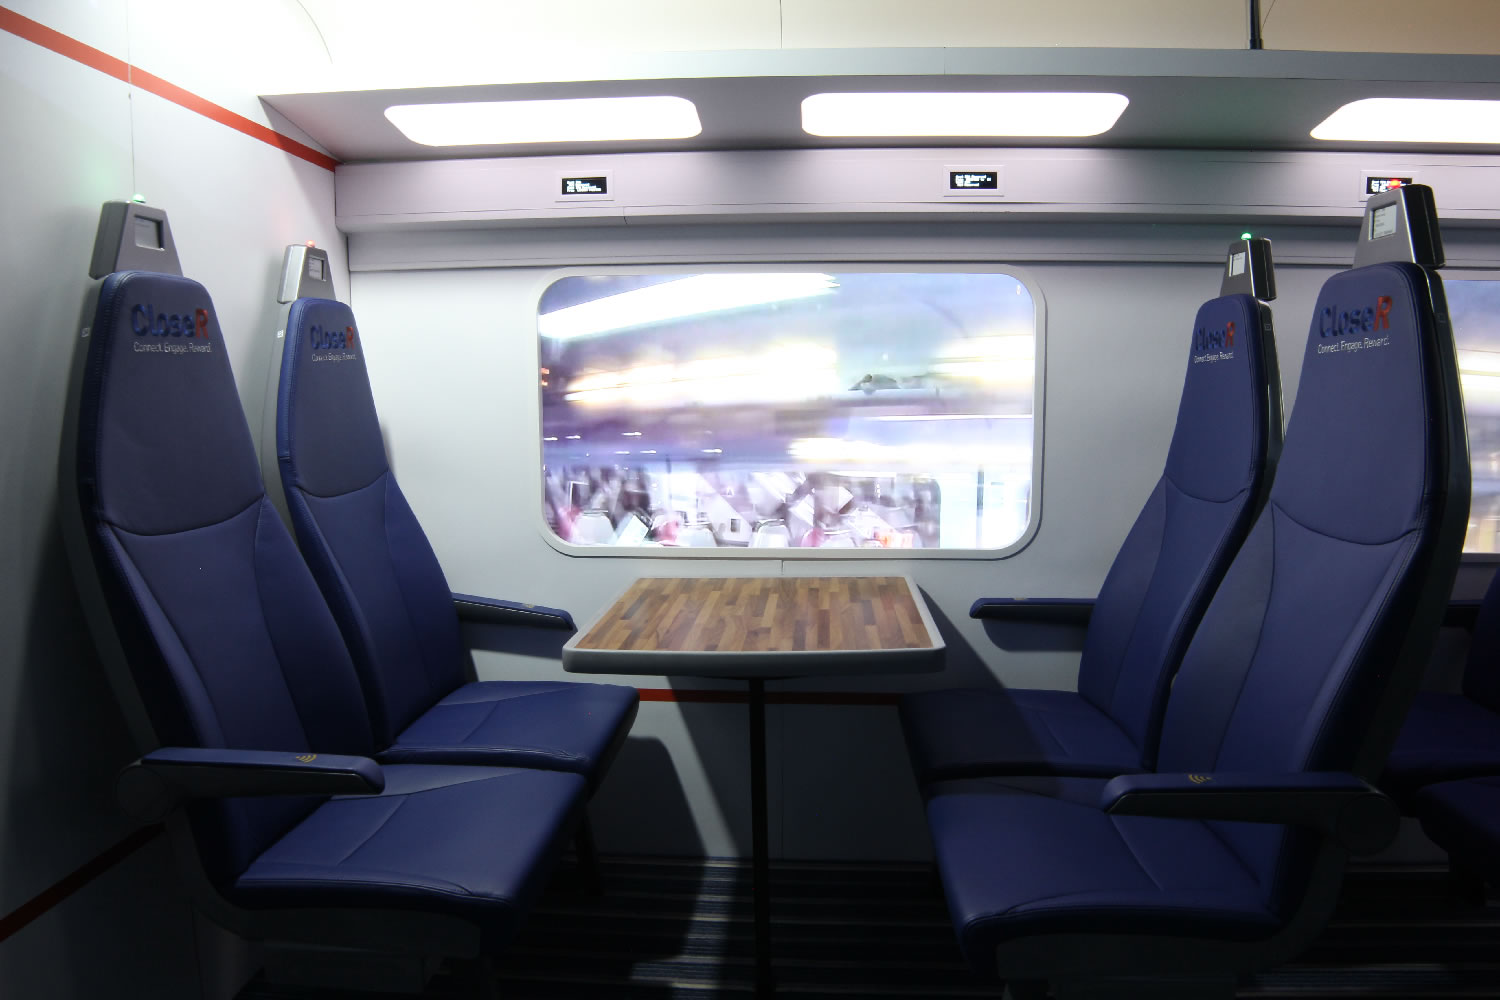
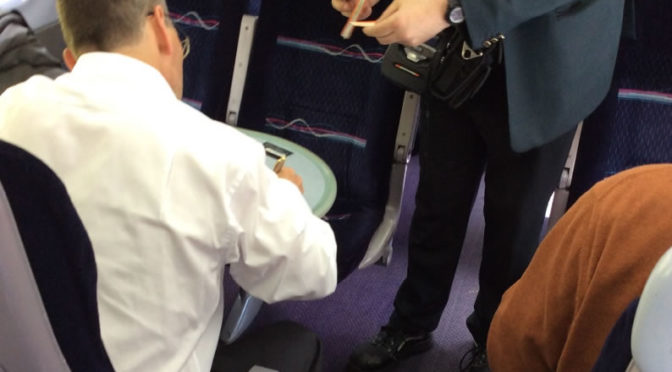
I was invited to take photos of the technology demonstrator created at the end of the CLoSeR project. This prototype is a life-size section of a train carriage containing seats, tables, and the embedded systems developed during the course of the project.
In this occasion the demonstrator was installed inside the WMG 3xD simulator. This location allowed the visual simulation of a train journey with projections on the 360° wall, combined with real video footages displayed on the windows.
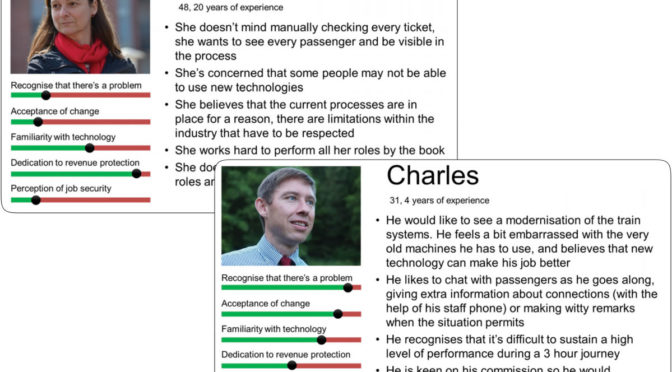
I’ve designed a few customer journey maps as part of the deliverables to a large innovation project. This work is part of a consortium formed by two academic institutions and four industry partners named CLoSeR. The collaborative nature of this research requires synergy between academia and external organisations, combining research methods to better inform the production of innovation that could improve user experiences.
One common way to understand and visualise UX is through the design of Customer Journey Maps, which … Read more →
I’ve been playing with different photography techniques and styles, and some of the results can be found below.
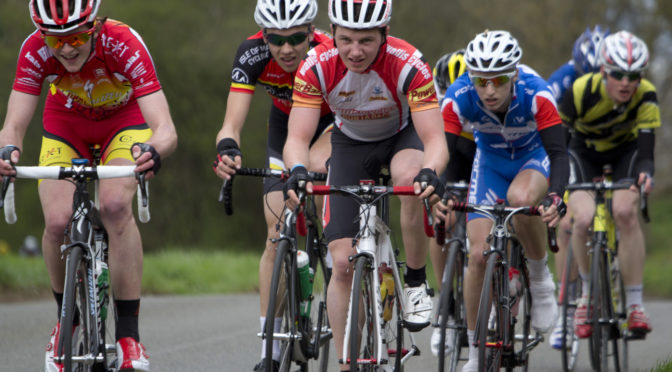
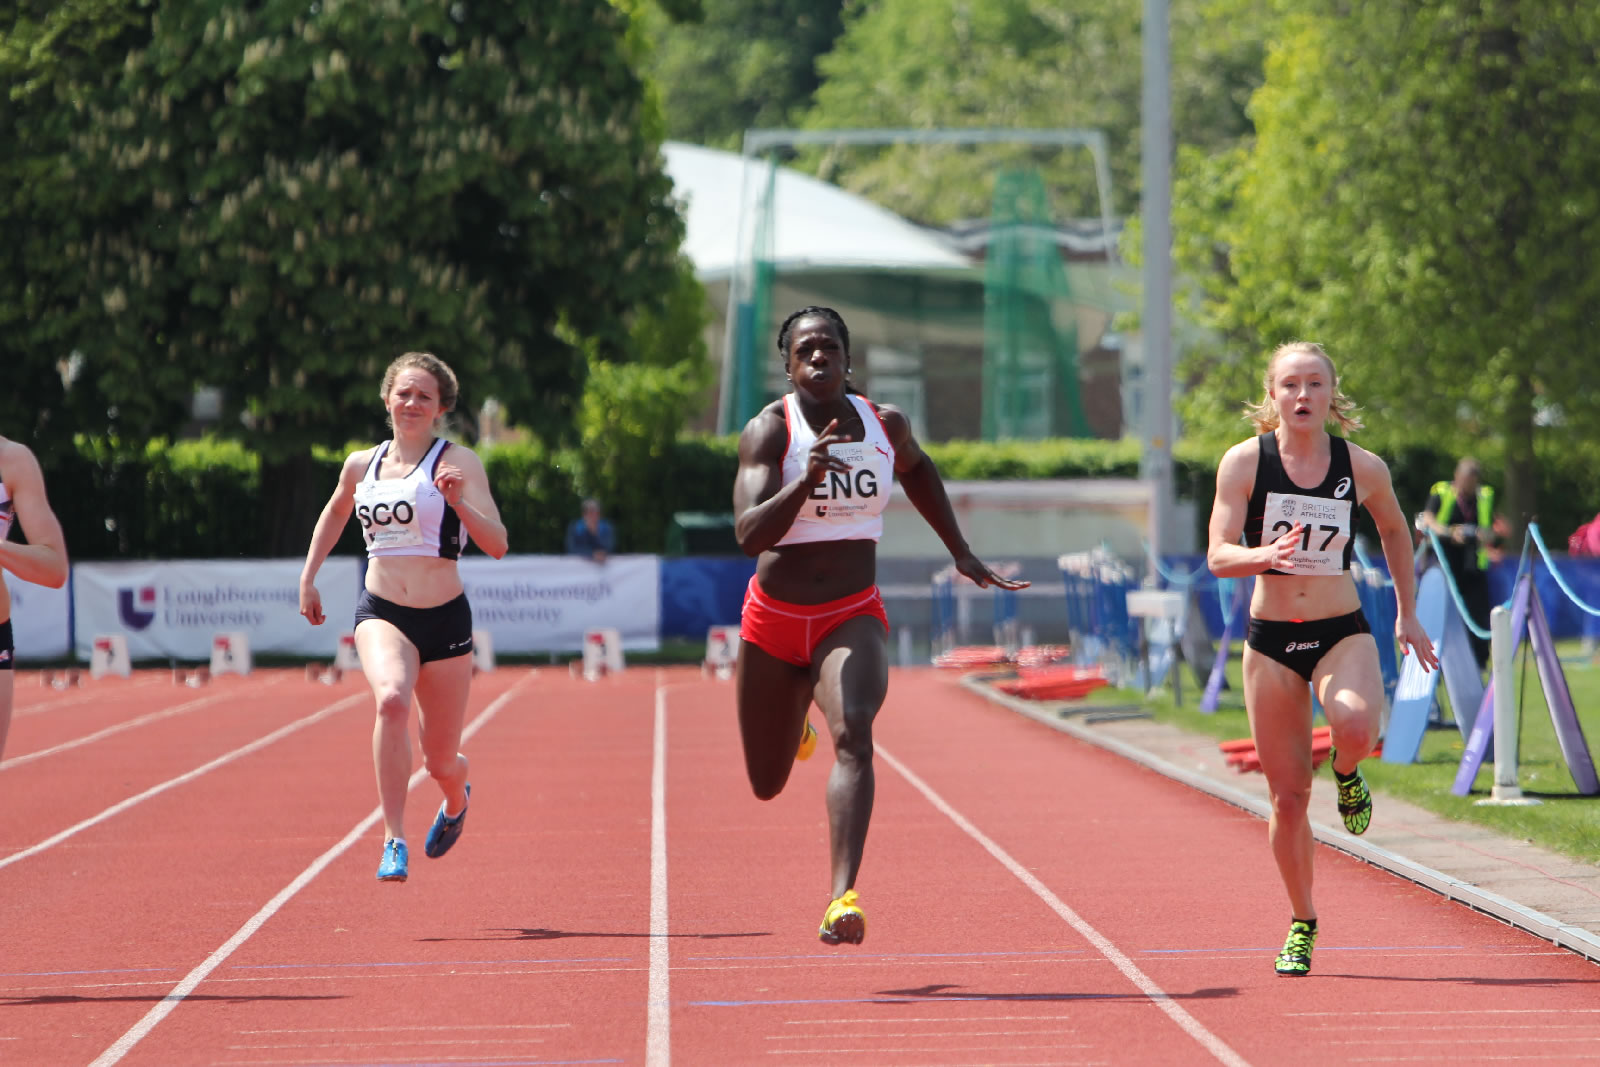
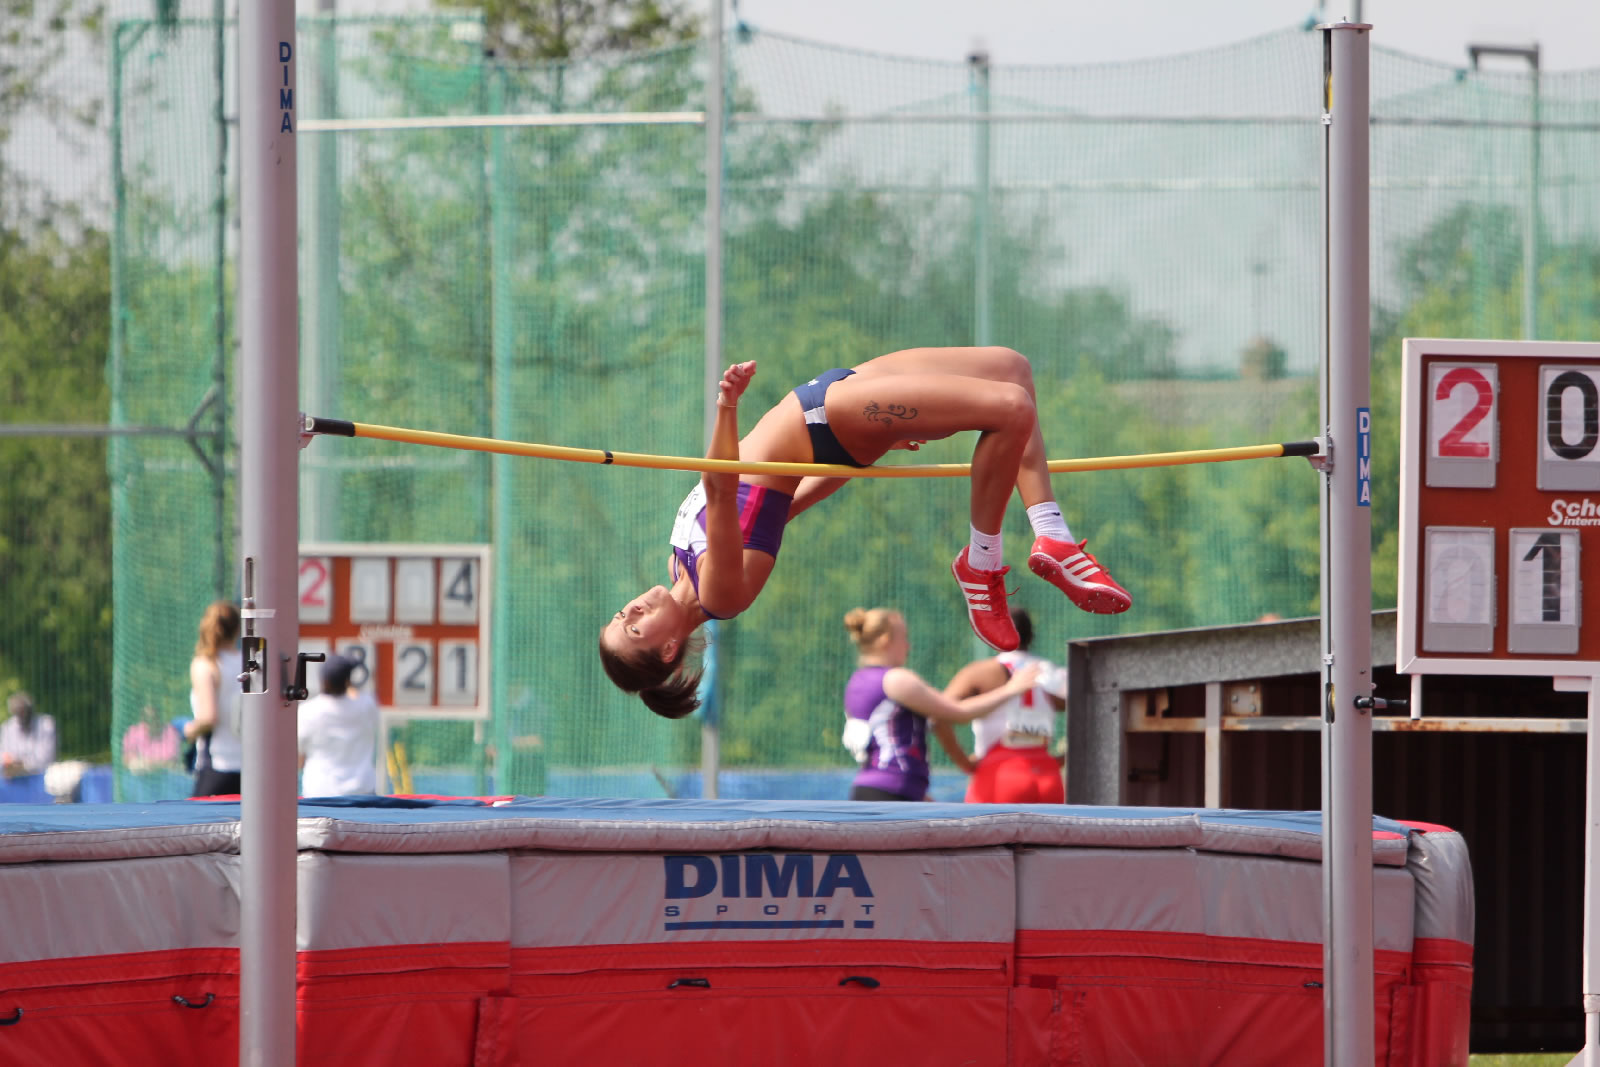
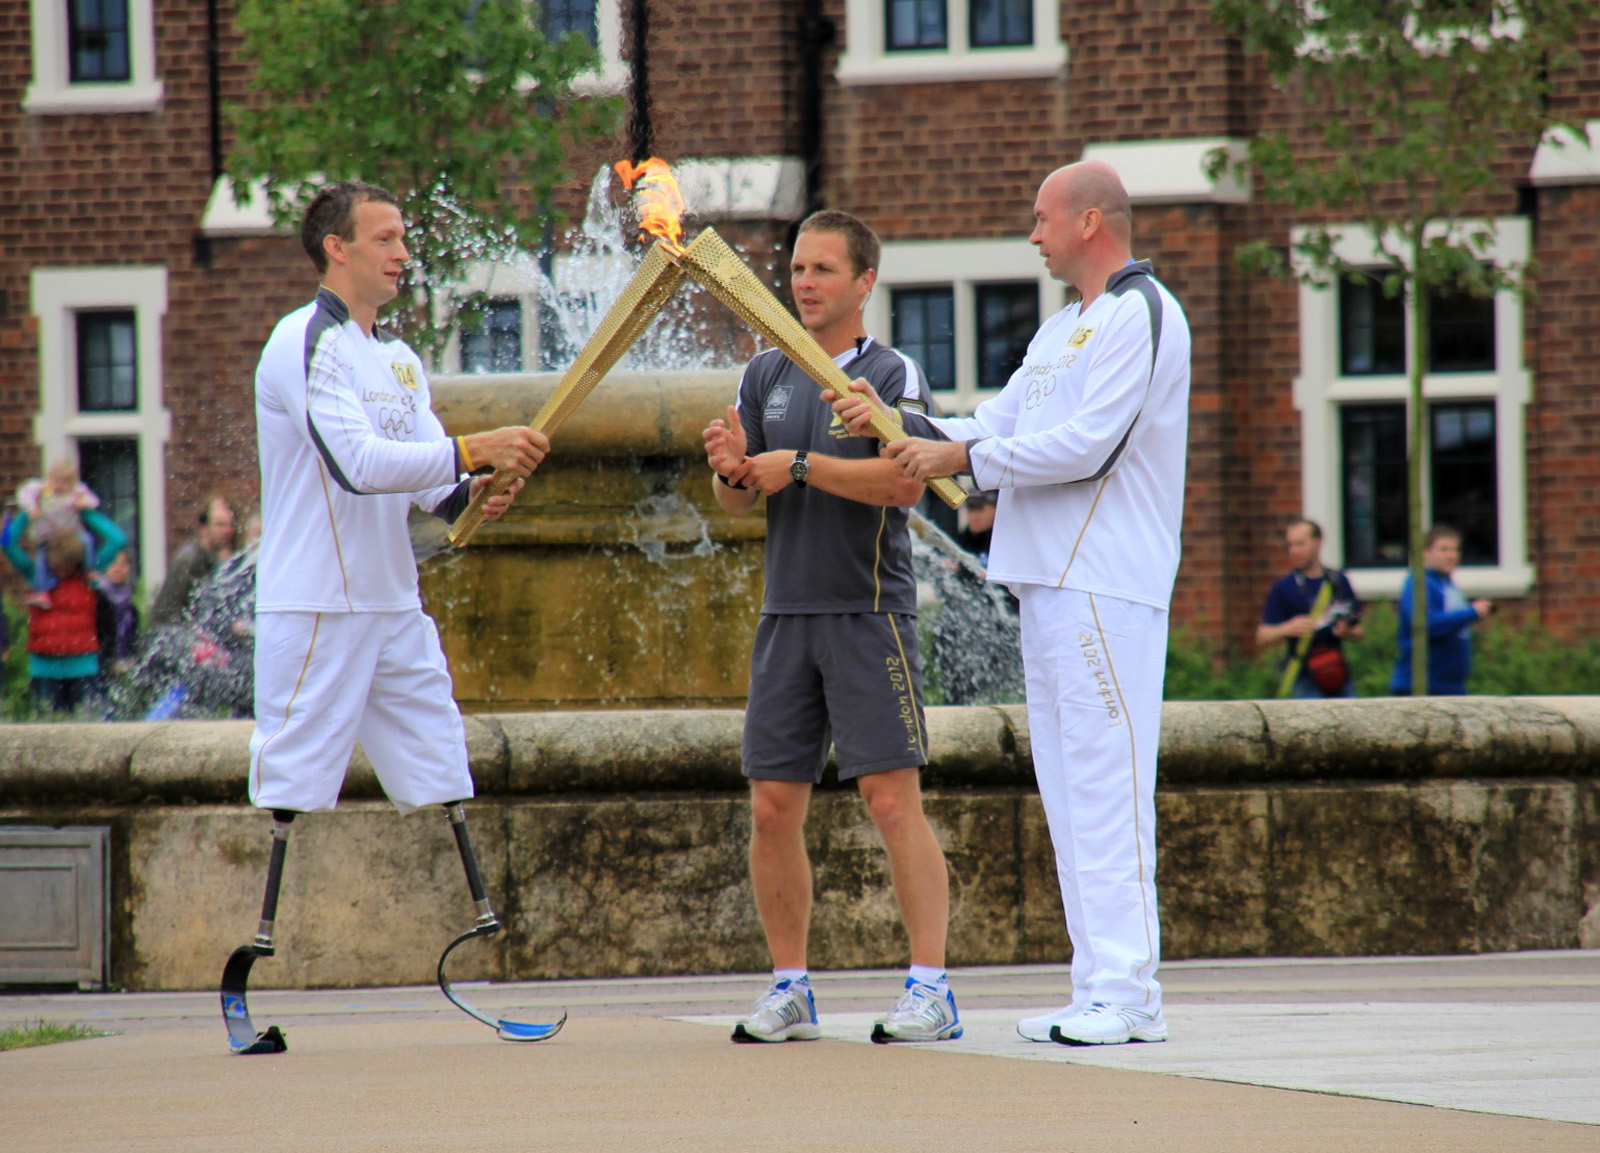
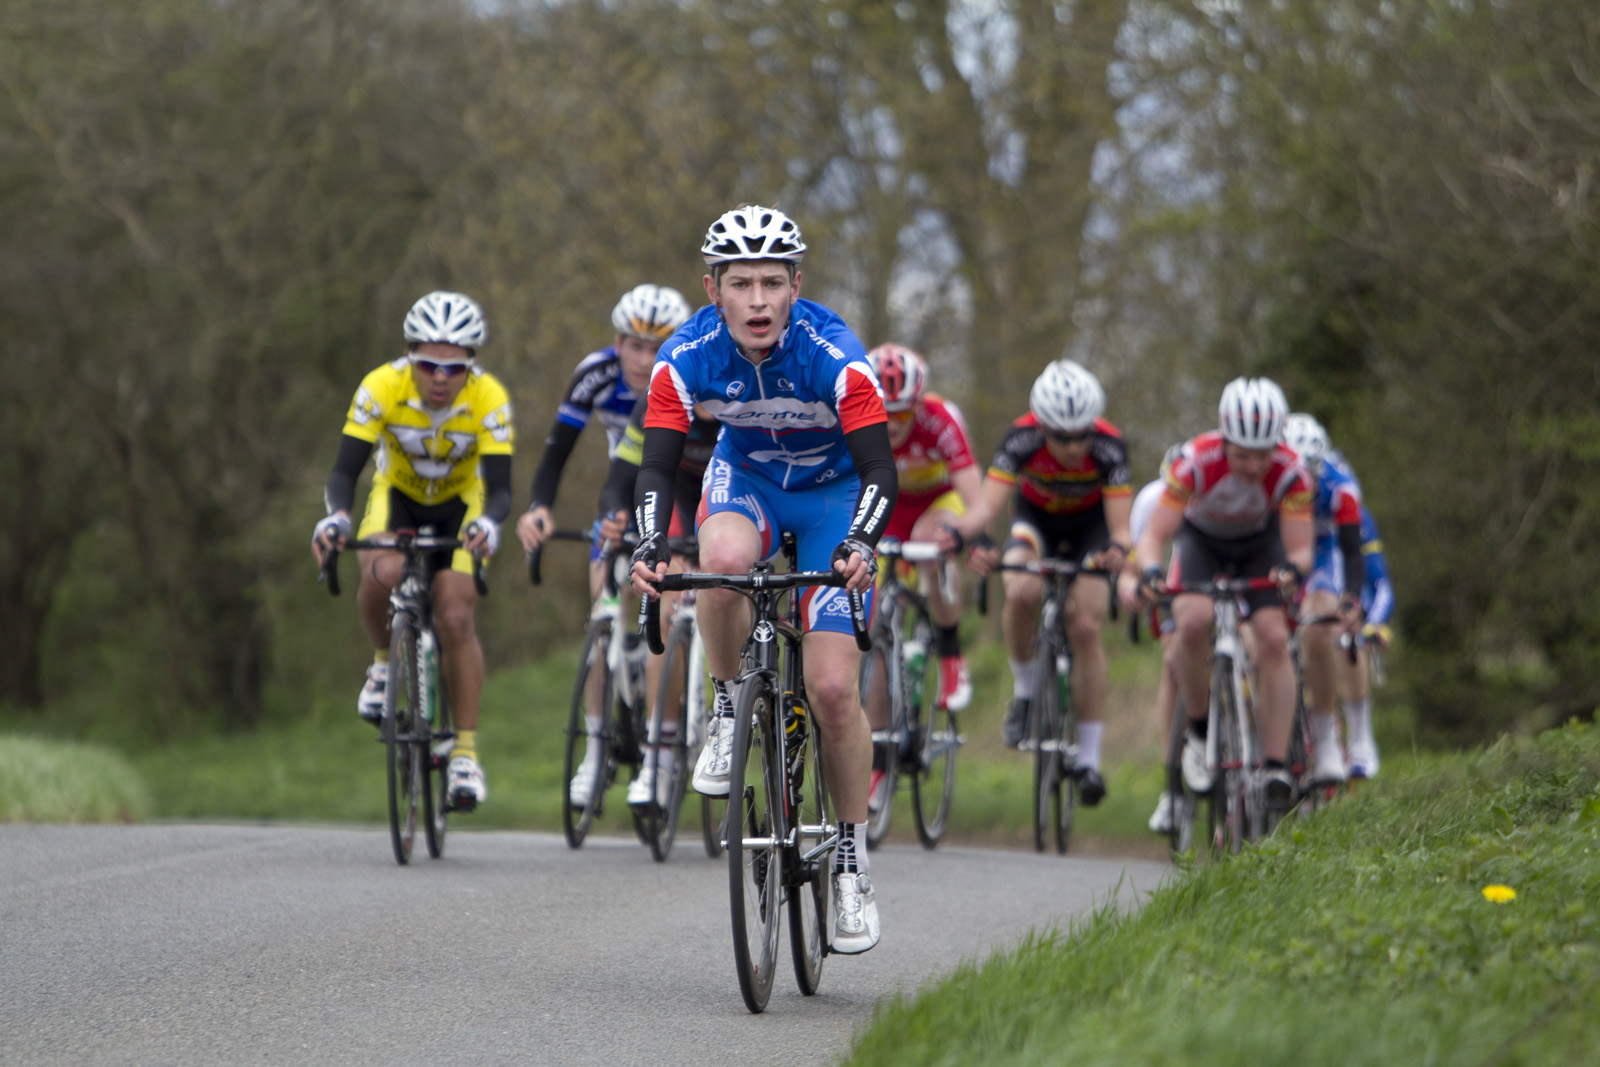
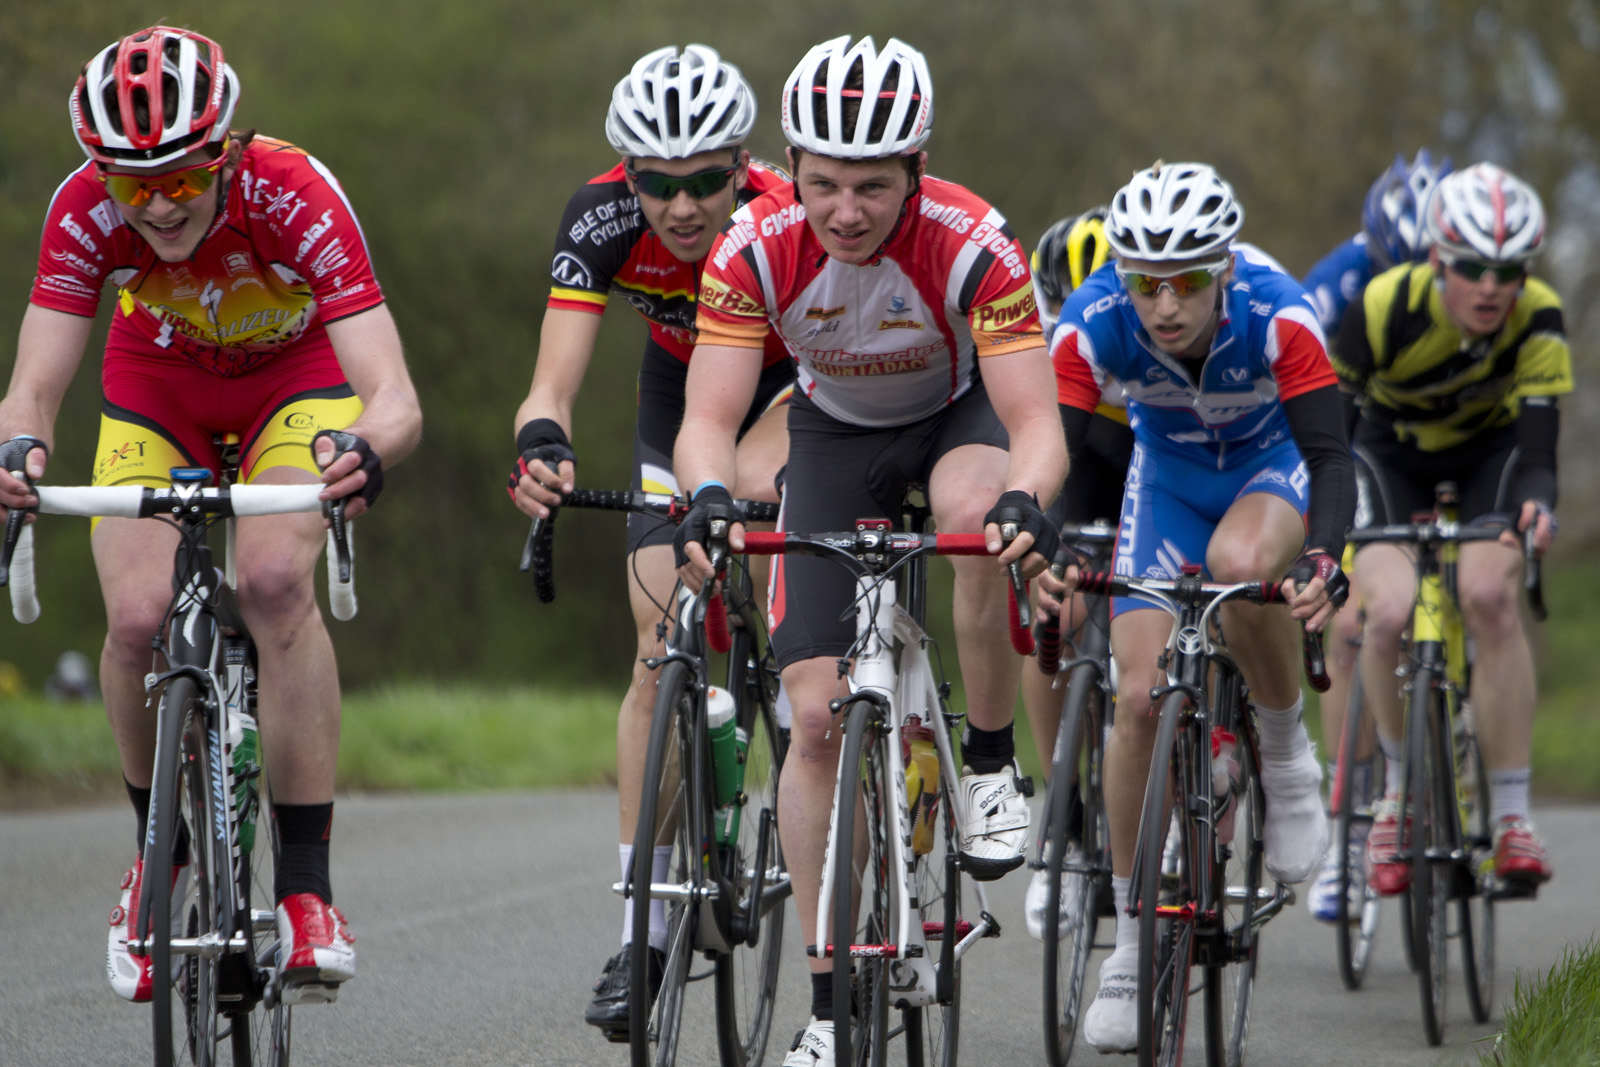
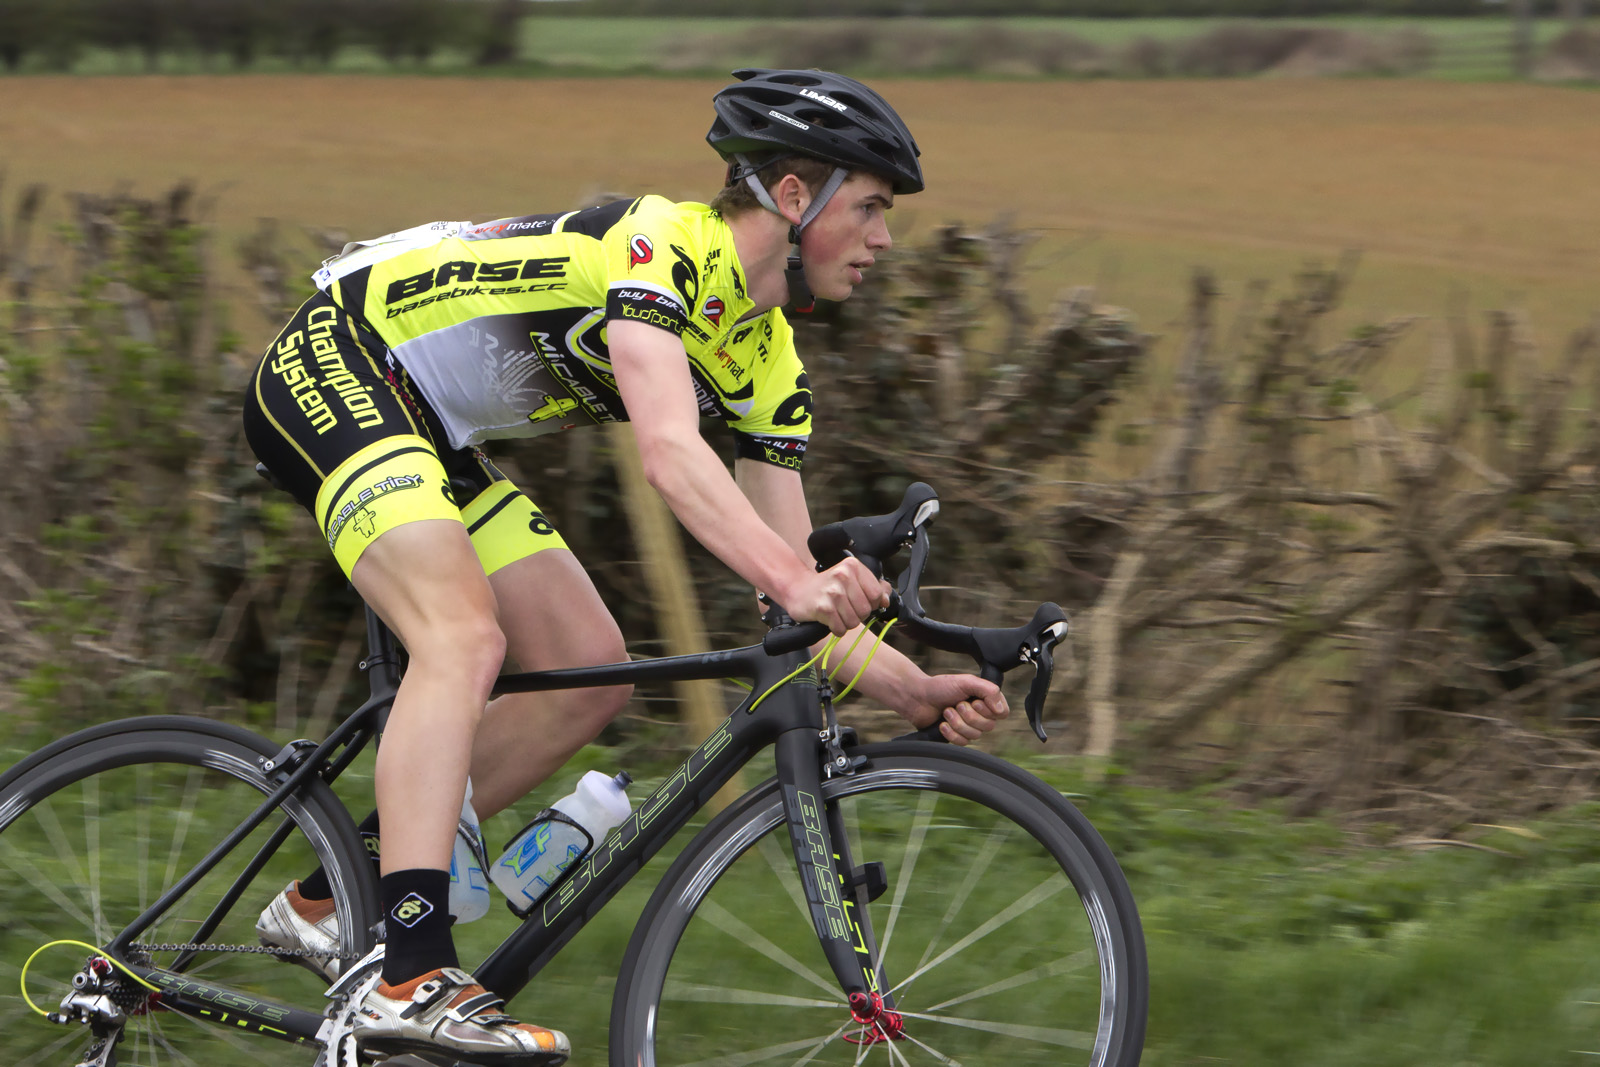
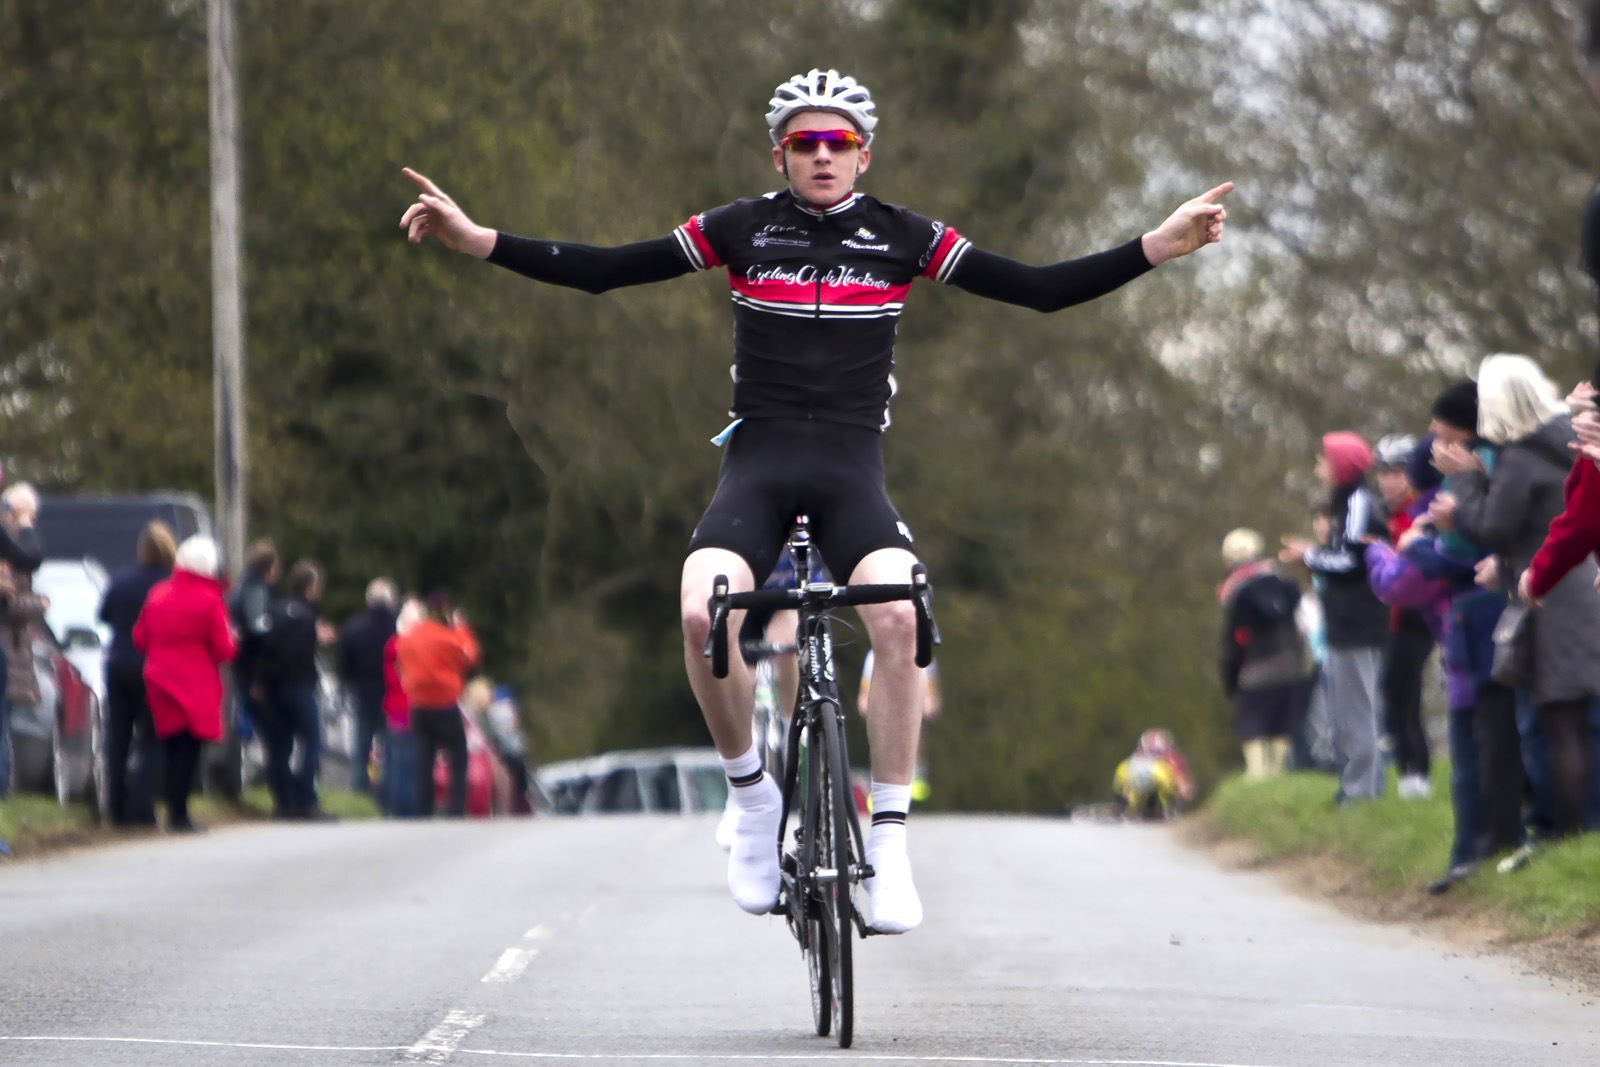
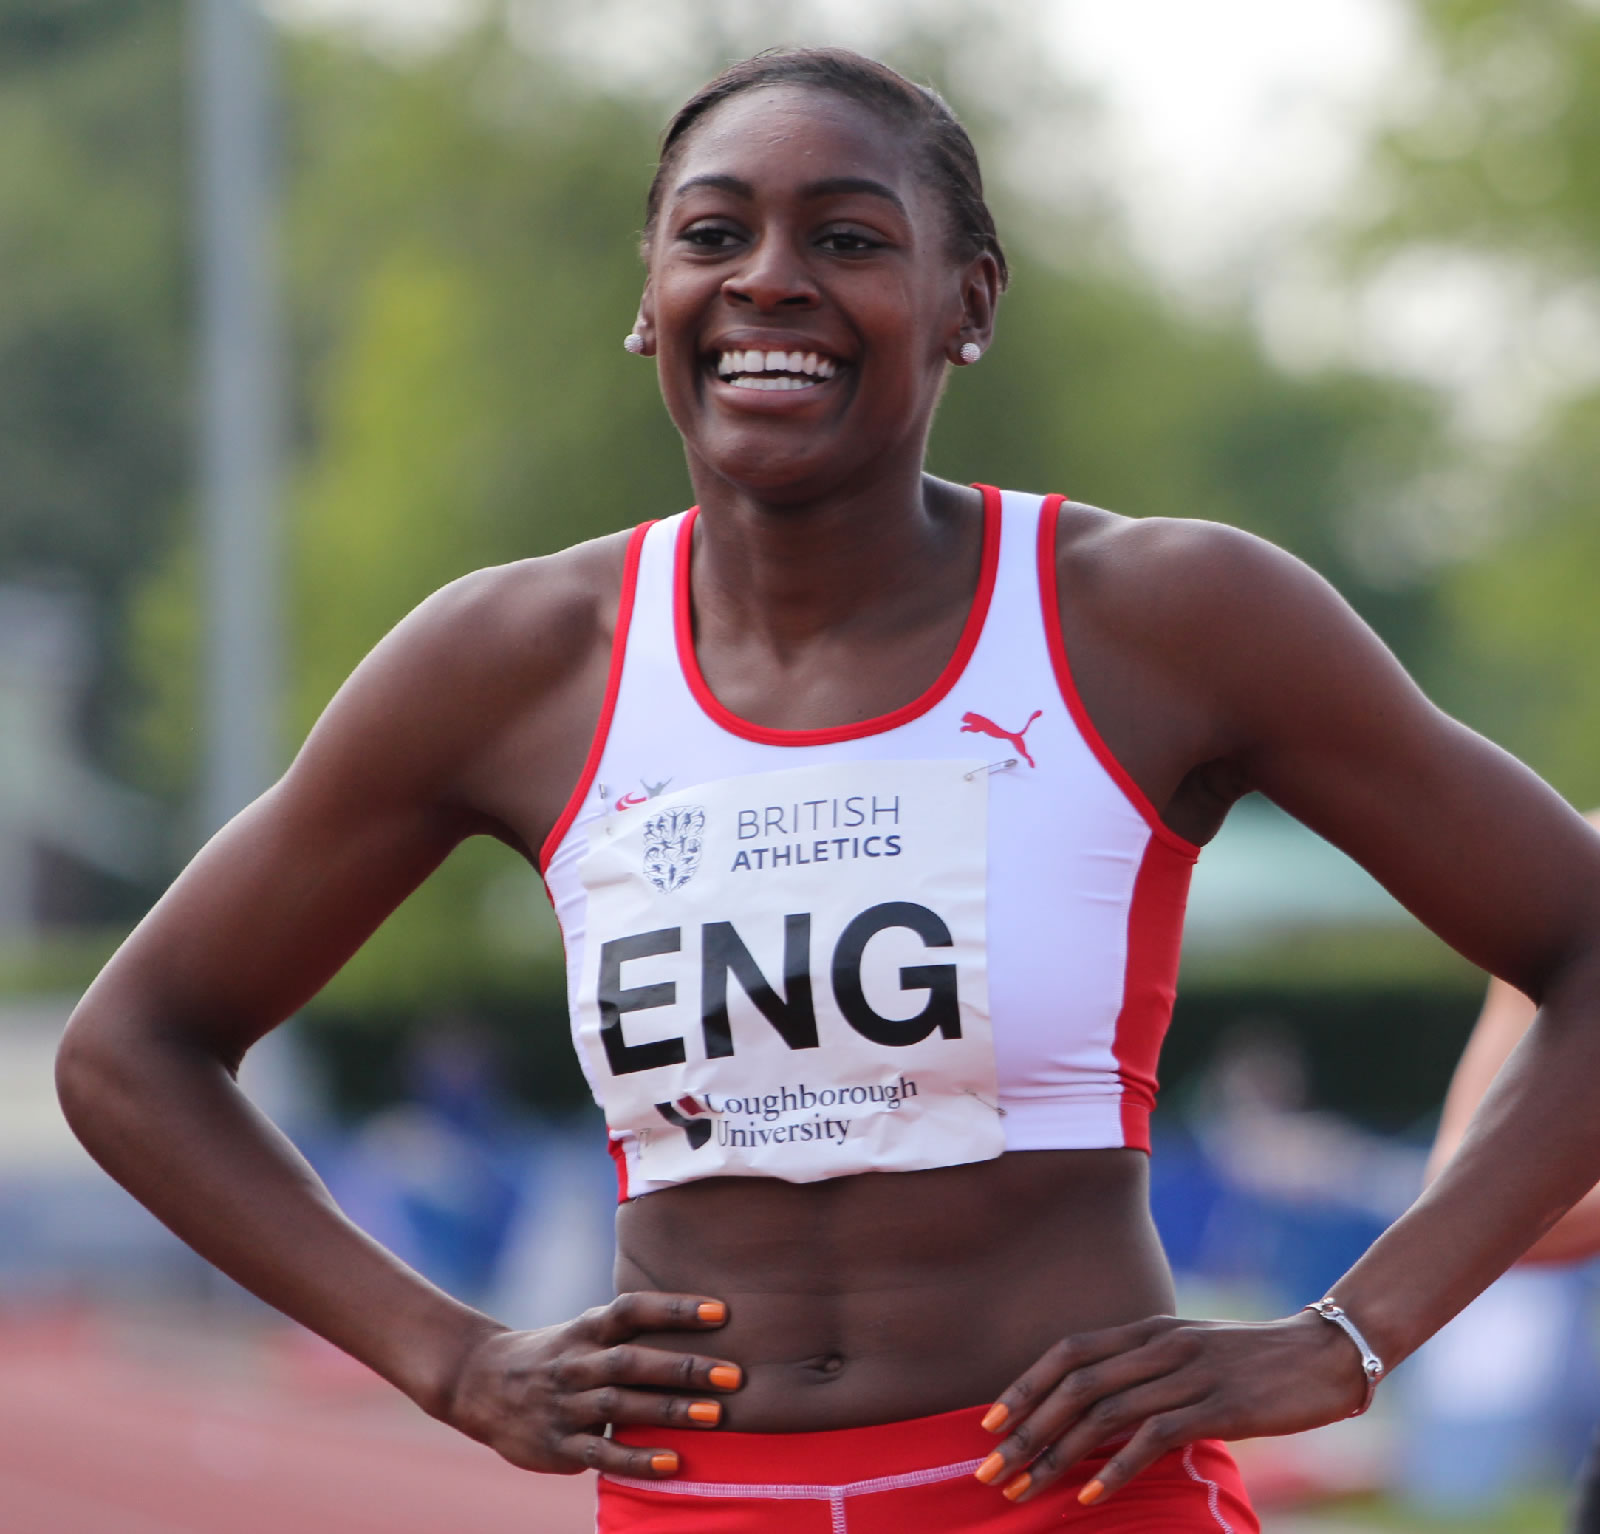
Sports
I’ve been taking photos of sports events, both as a hobby and also hired by organisers. Examples include the International Athletics, in Loughborough, which had a few olympian medalist as competitors. I also covered a few road bike races, and at that time I had set up a website to sell shots to competitors.
One of the design tools used to provide a clearer picture of users beyond market segmentations and demographics is personas. They can give a precise description of users and define what they wish to accomplish, representing archetypical users to facilitate the understanding of their behaviours, needs, motivations, characteristics and limitations. Having a small set of personas makes the real users more tangible, especially for large organisations or multi-partner projects with diverse stakeholders, where some of them are not familiar … Read more →
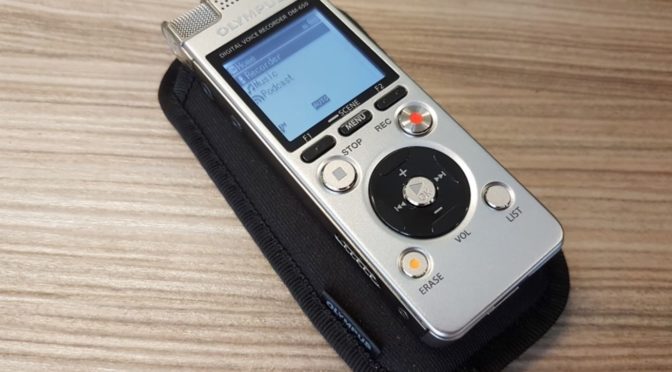
One of the most used methodologies applied to understand users and their experiences are interviews. Online, phone-based or face-to-face semi-structured interviews are performed to understand user expressions of attitudes, feelings, preferences, needs and behaviours. Using a semi-structured method it’s possible to explore in more depth specific aspects raised by participants, and allow for richer data collection.
Interview prompts
During interviews, it’s possible to use materials to prompt participants to develop their ideas and describe aspects in more details. Examples include … Read more →
One data collection methodology that I sometimes use is the observational method called ‘shadowing’, when a trained researcher investigates, unobtrusively, the activities that individuals perform as they go about their business. Shadowing involves a field visit, which gives the opportunity to observe and meet people where they are comfortable, at their habitual places of work. It can lead to specifications of concrete details about work activities, and this knowledge can help write requirements to be implemented in subsequent development phases.… Read more →
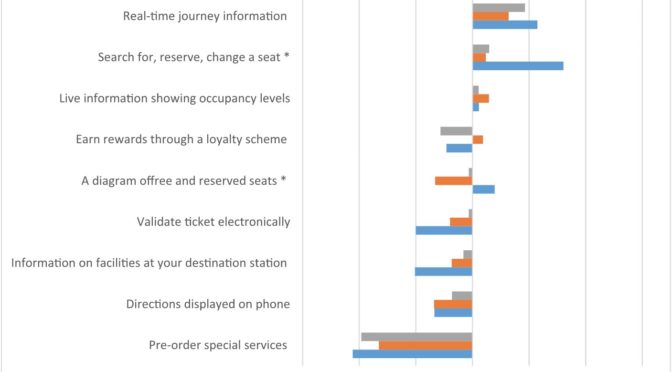
We are seeing the use of alternative approaches to measure user attitudes, specifically, those that offer more robust, useful and actionable attitudinal data. One of these methods is the Best-Worst Scaling (BWS), which has risen in popularity as a choice-based measurement approach. BWS experiments collect both “best” and “worst” information from a set of statements about the product or service offering. These could include attributes, features or product benefits. As such, more information is gathered about the top ranked and … Read more →